OVERVIEW
About the Project
Using particulate matter to do instant visualization on map. In addition, Air IoT provides spatial data query function, including landmark, address, coordinates, and device name; User can store favorite sensing device, and overlay related map layer, such as wind field and traffic network information. Everyone can monitor environmental air quality changes around us now.
-
Role:
UI/UX Designer -
Tools:
Sketch, InVision, HTML, CSS, Bootstrap, Leaflet(JavaScript library), Tableau -
Client:
EPA -
Timeline:
May 2017-July 2018
GOAL
The Challenge
Combining the environmental resource data, services and application functions of the Environmental Protection Administration's existing environmental cloud platform, GIS platform, and IoT platform, establish a web-based smart environment application system for providing Environmental Protection Administration (EPA) an integrated environmental sensing management and decision-making as well as supporting and providing public-related environmental applications and services.
RESEARCH
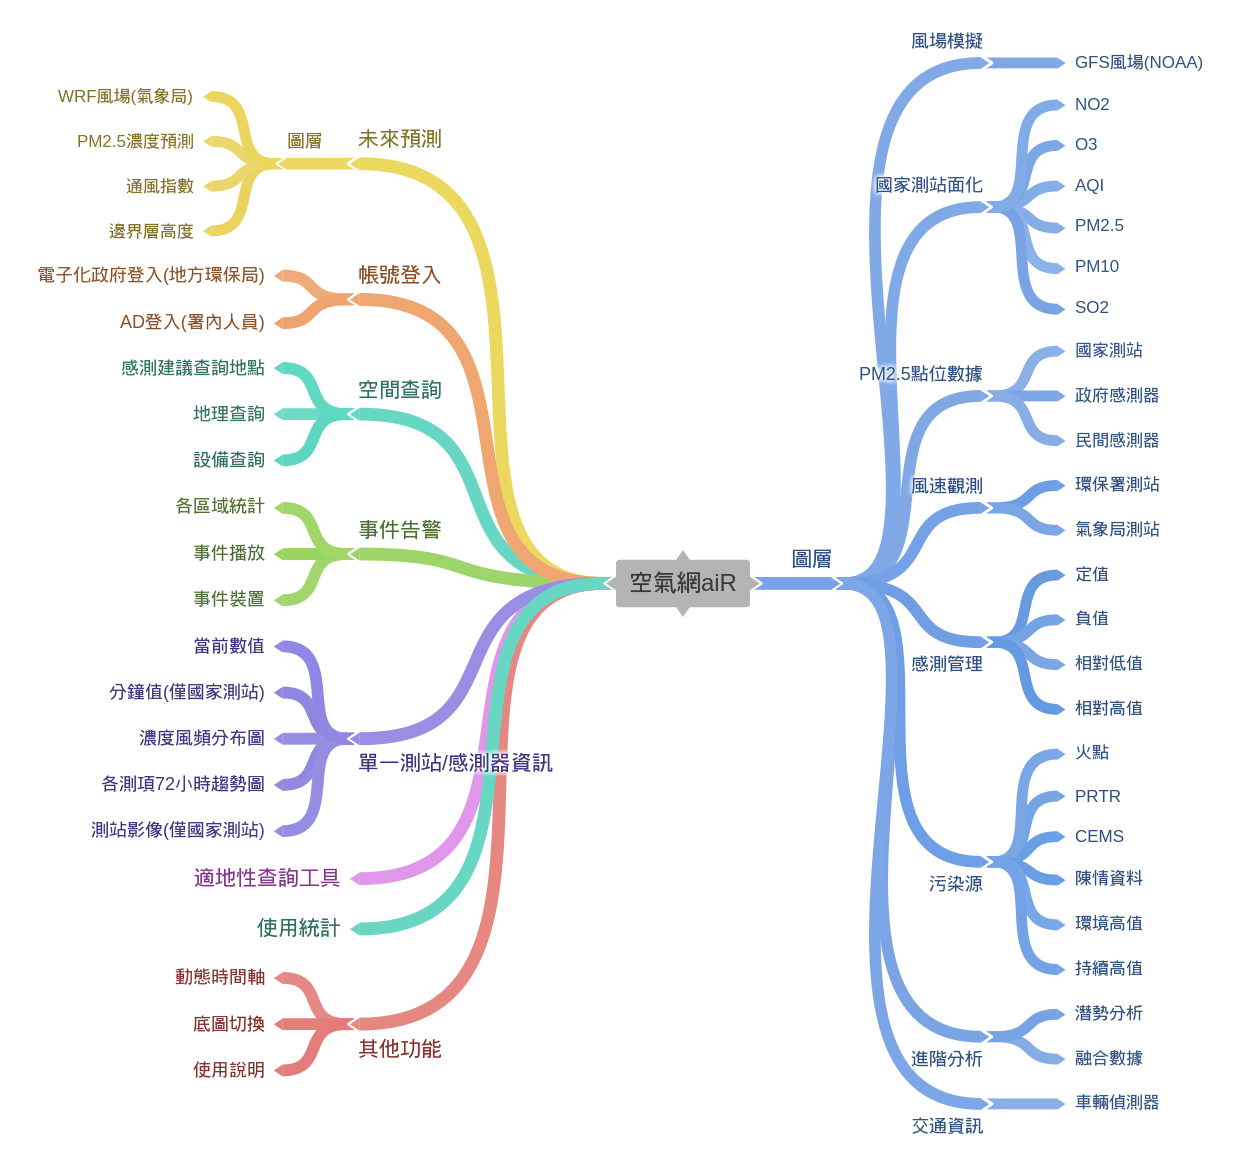
The Solution
In response to the requirements of sensing application analysis and the integrated display of the air-related meteorological data, we continue to expand the data visualization display function platform and combine the external unit value-added application data for meta-analysis. Providing correct interpretation of air quality trends, displaying potential hot zone maps, assisting operational requirements to grasp pollution trends, trace pollution hotspots, and plan cross-unit environmental sensing data query mechanism. In addition, the system will be available to EPA and the local Environmental Protection Agency to assist in the tracking and investigation of pollution sources, as well as supporting internal decision making and analytical application. The goal is to strengthen environmental protection governance and smart inspection capabilities.
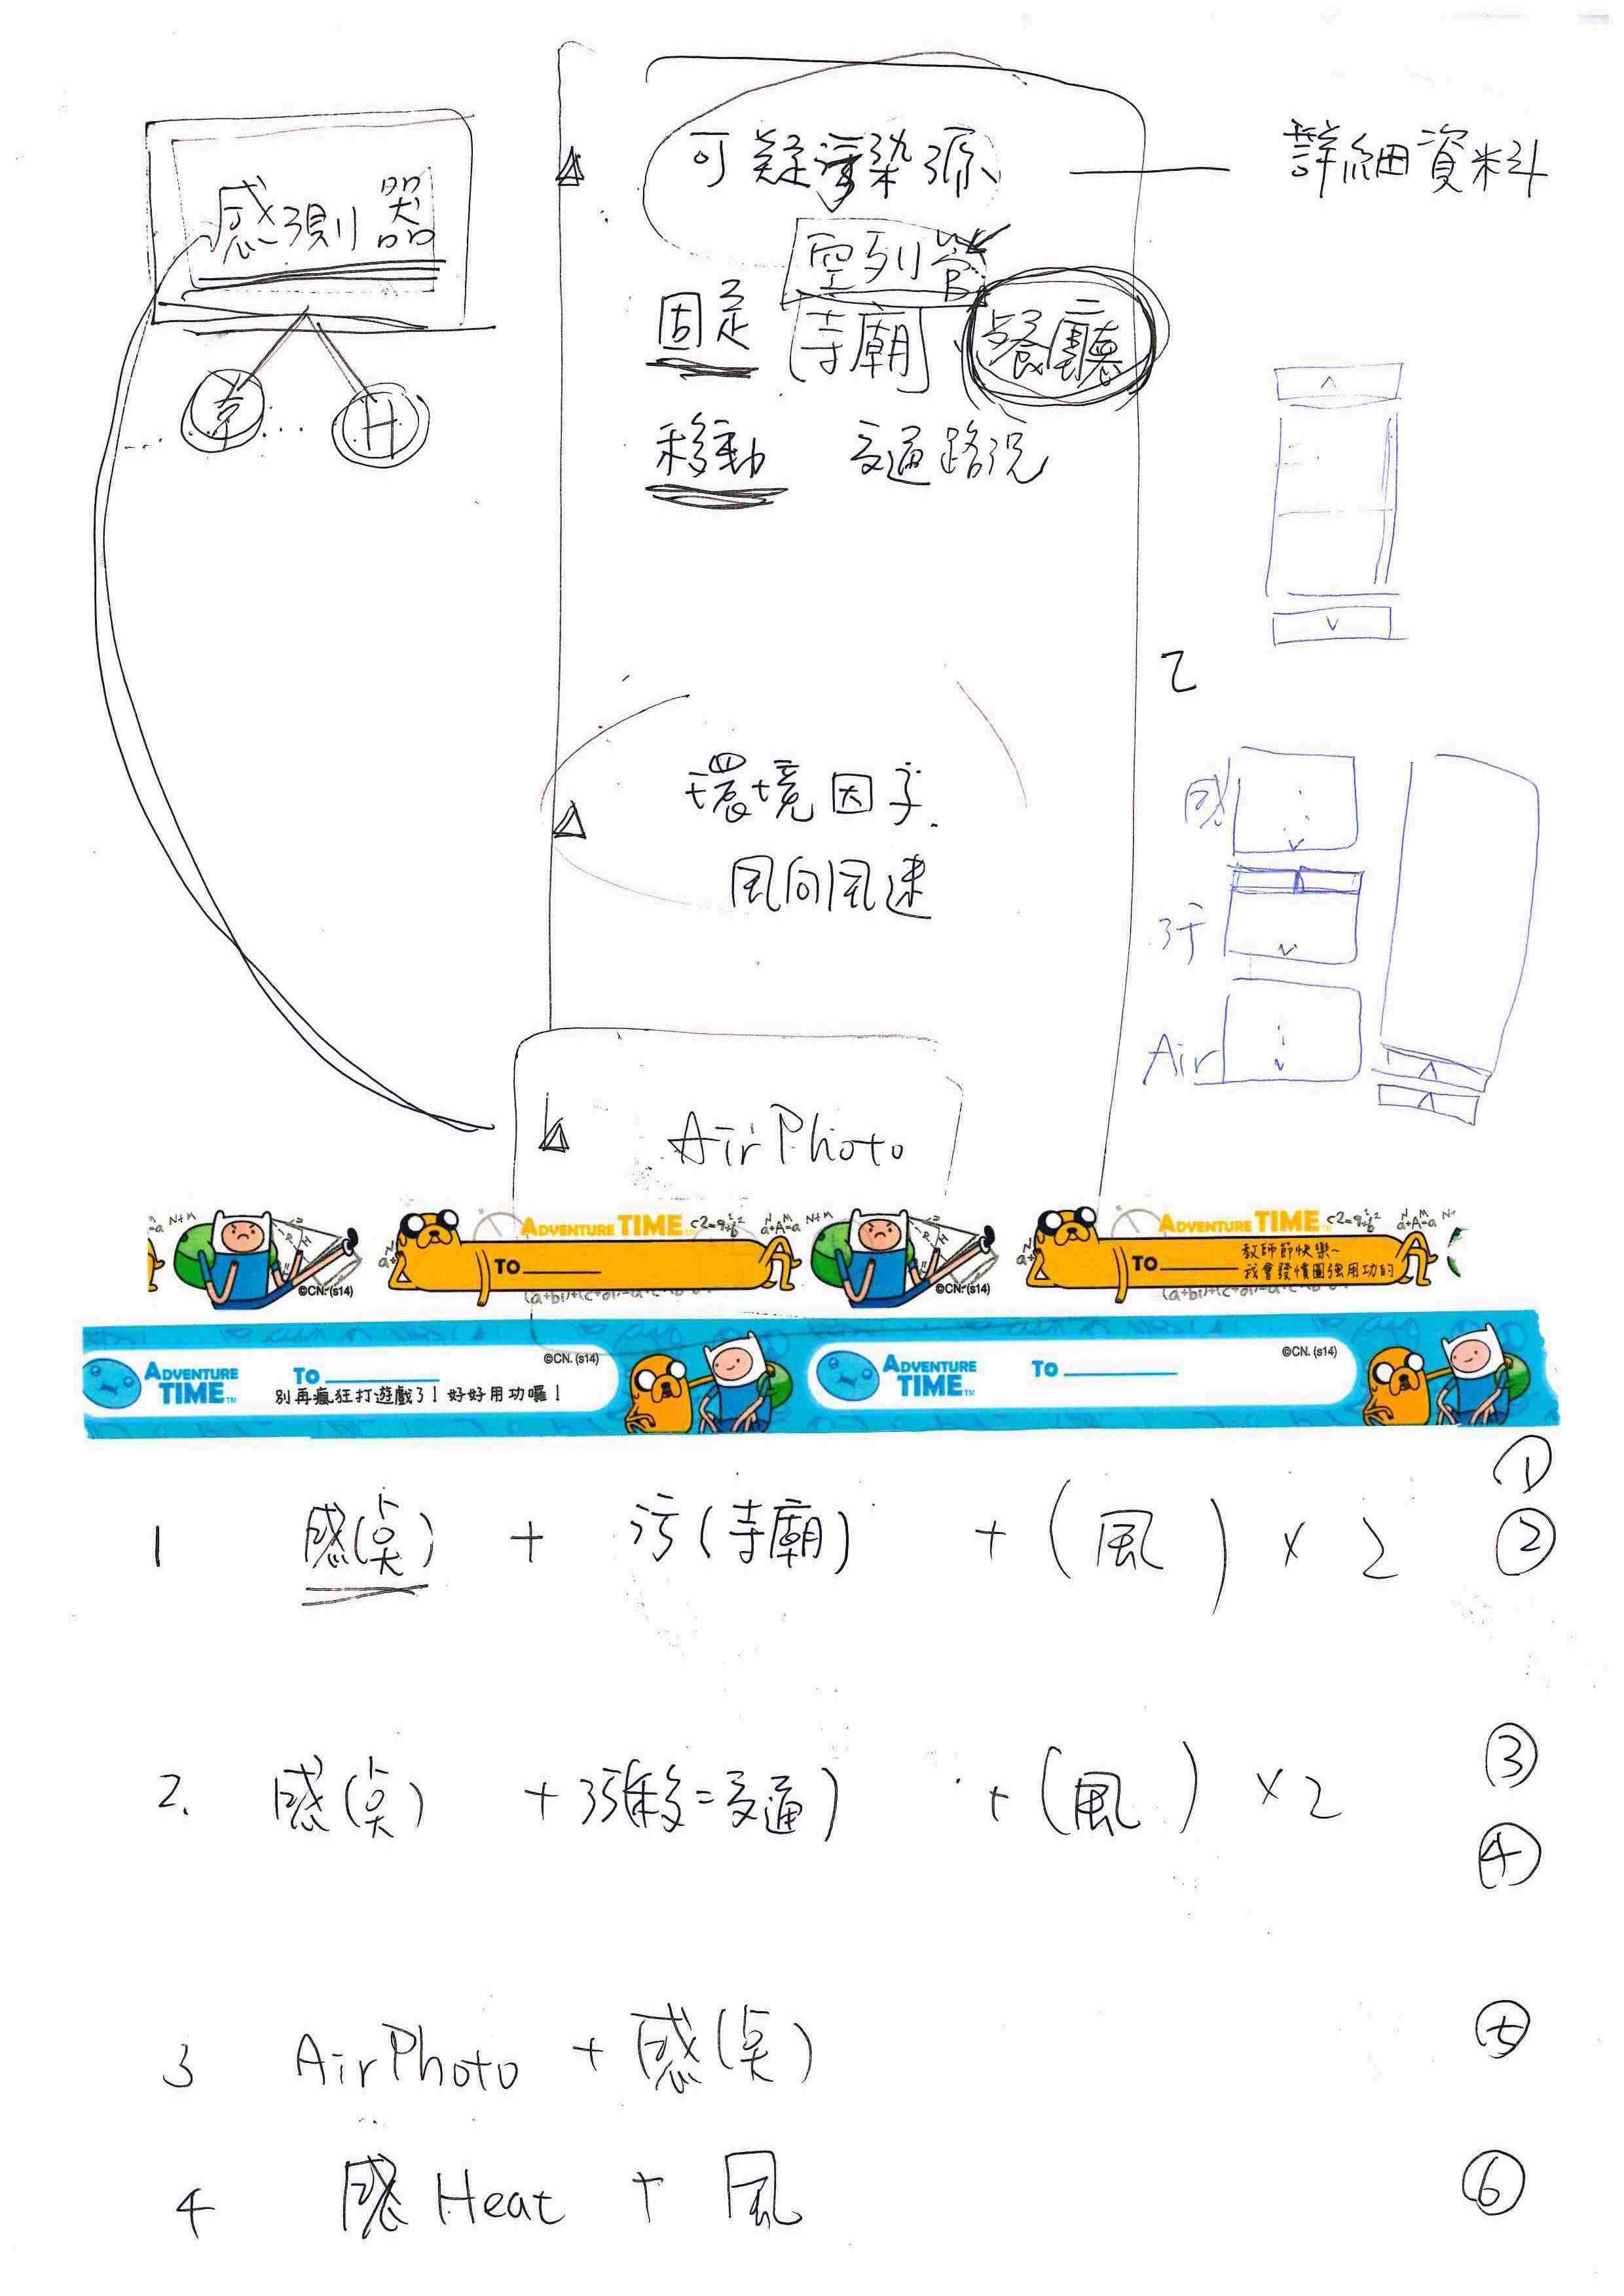
IDEATION
Concept Sketching
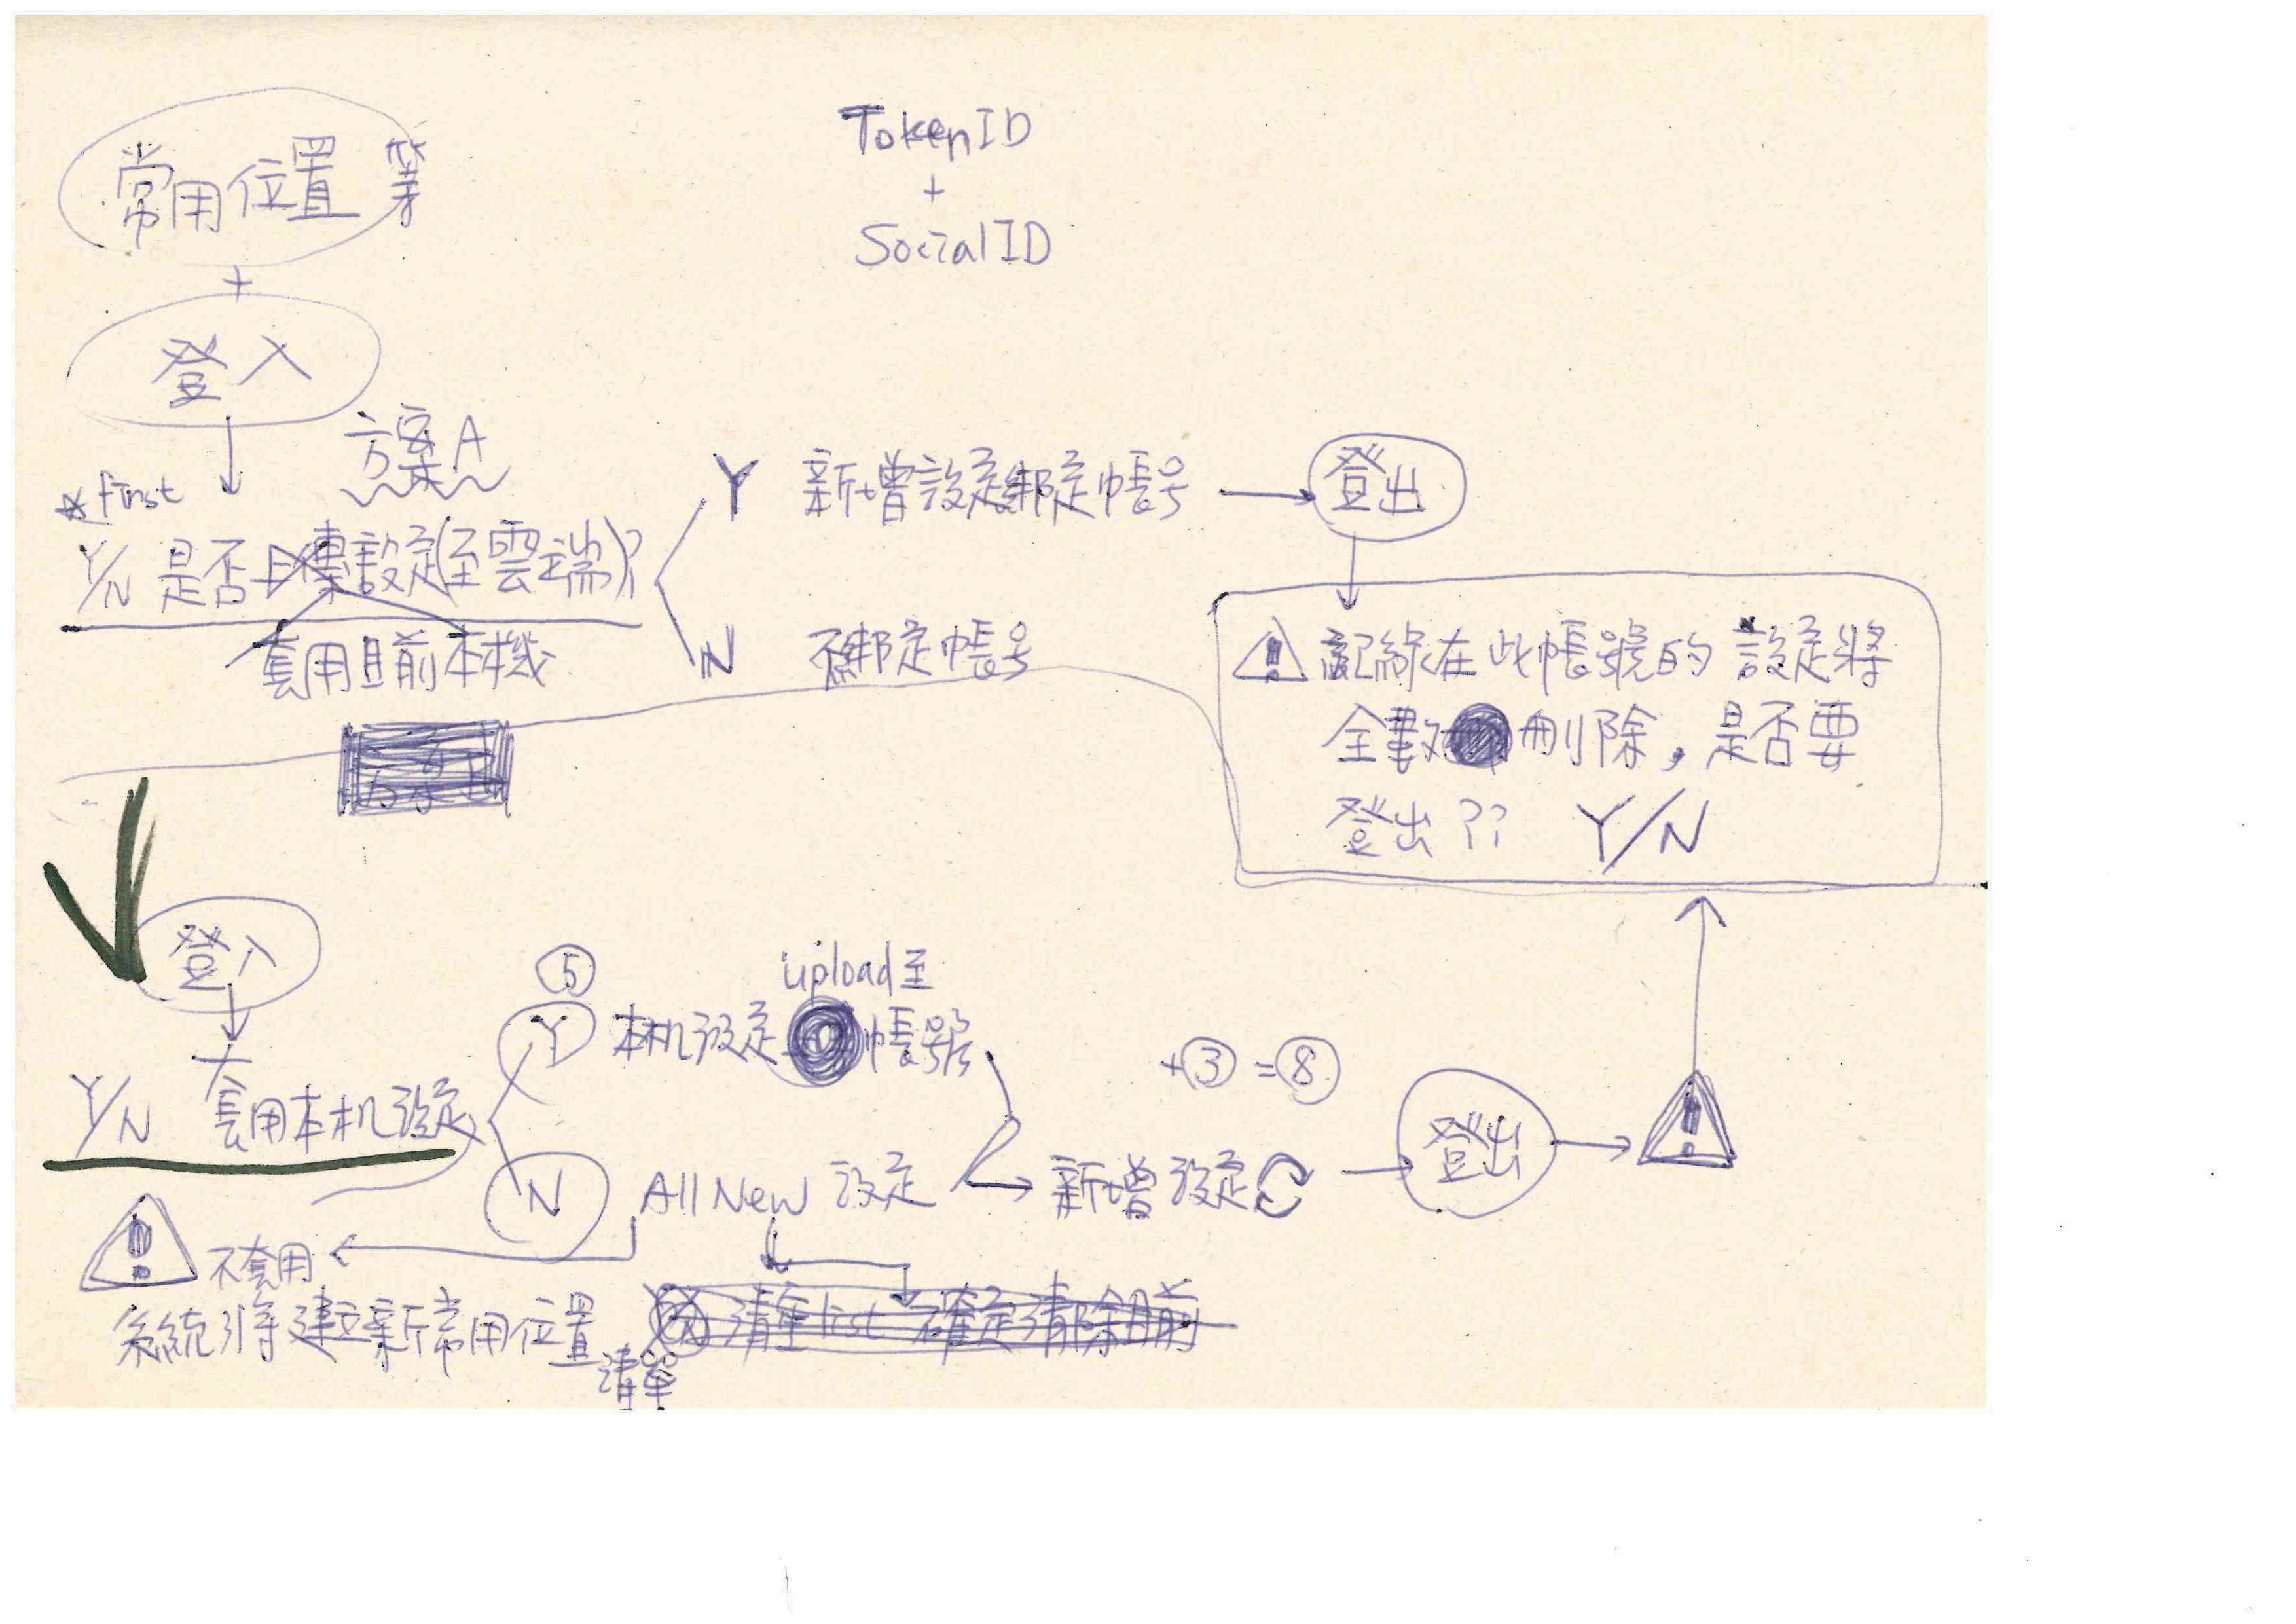
USER FLOW
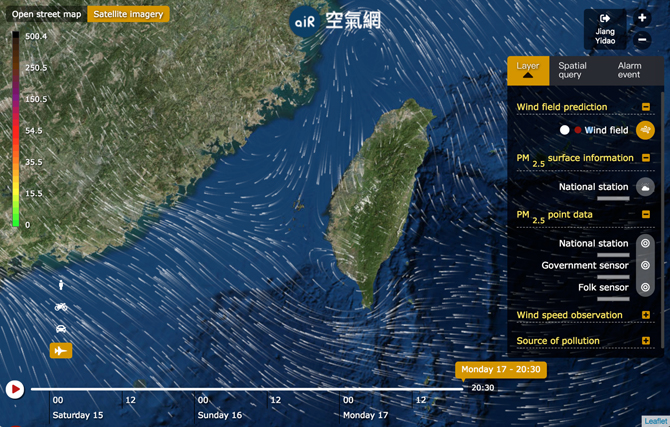
High Fidelity Design
-
Dynamic Wind Field Prediction
Combining NOAA (National Oceanic and Atmospheric Administration) global wind field simulation data, it can master large-scale environmental change information and effectively visualize data.
-

-
-
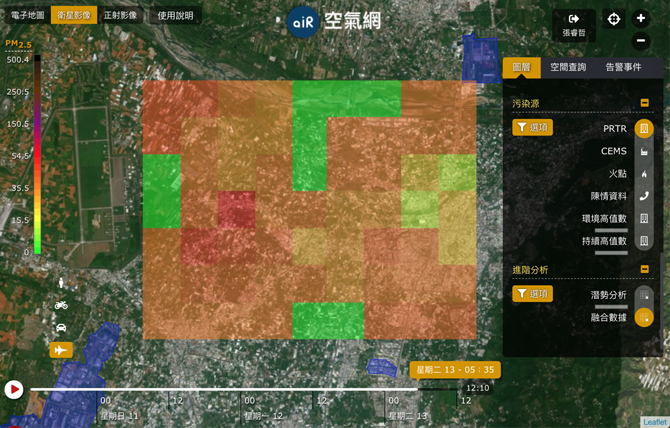
Spatialization Estimation
Data estimation based on 77 national monitoring stations of Taiwan, it can provide location query for point data combined with dynamic display.
-
Potential Pollution Inspection
Dynamic displayed with different time intervals, including three days, seven days, and thirty days, it can effectively help to point out pollution source and inspection work.
-
-
-
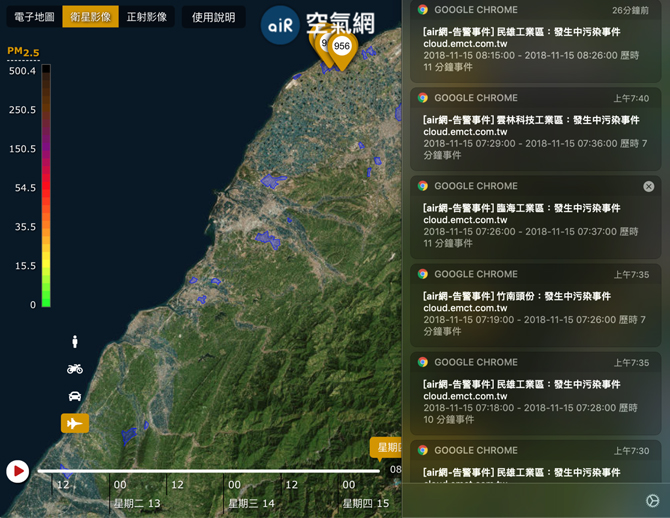
Wisdom Alarm Event
With cloud computing, data is monitored within 24 hours per day without interruption, and suspicious events are sent as warnings to the authorities concerned.
IMPROVEMENT
Case Study
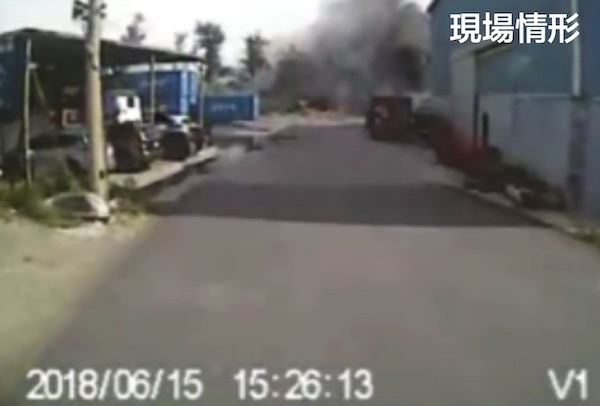
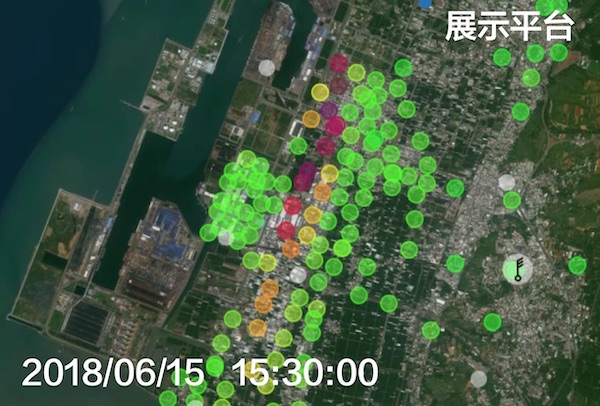
Heilongjiang Container Warehousing Co., Ltd. Combustion Event
Taichung - Burning event occurred at 3:15 pm on June 15, 2018
The blue point on the air network platform in the film is the location of the Heilongjiang container warehousing, and the white icon is the weather indicator of the EPA station. By presenting it, we know that the wind was north. At about 15:30, the sensor was found to have a band-like anomaly and continued until around 18:00 that day. The system instantly informed Taichung City Environmental Protection Agency inspectors to the scene.
CONCLUSION
Reflection & Next Step
Data analysis and exploration can be more effective in presenting insights from the perspective of the complete geosphere, atmosphere, and biosphere data. The Ministry of Environment and Resources will be established in the next year, and data will be integrated into inspection. Network configuration and application can be expanded to a unified architecture, either. The project is still based on public user, with the hope to make extensive use of network resources and tools such as cloud computing and data analysis, cross-domain data analysis, proactively exploring environmental trends, and focusing on issues and needs of the public. Bring together the wisdom and feedback of the public to meet the expectations, proactively perceive, and screen out the target users.
To review the needs of the business of the Environmental Resources Department, we develop the trends of environmental-related information technology. In order to master the development trend of the communication and create a high-quality information application environment, we introduce it into various governance levels to enhance environmental awareness with the hope of implementing sustainable development that emphasizes both society, economy, and ecology.