OVERVIEW
About the Project
The development of Taiwan's smart agriculture goes one step further. Taiwan Agricultural Research Institute developed the i-Plants field cultivation management system, combining geographic information systems with aerial photography, the internet of things, and big agricultural data. Not only providing crops growing information, but also the processing and packaging information to consumers. Farmers using i-Plants can also receive early warning notification of plant diseases and insect pests. The goal is to schedule a cultivation plan in advance and improve crop quality.
-
Role:
Product Designer -
Tools:
Sketch, InVision, HTML, CSS, Bootstrap -
Client:
Council of Agriculture, Executive Yuan -
Timeline:
December 2013-July 2018
GOAL
The Challenge
"i-Plants is not only a service for consumers, but also for farmers." i-Plants started to research and develop in 2015. After two years of testing, it is fully developed and will be released to the market. The target users are agriculture production&marketing groups and agribusiness. The goal is to accelerate smart agriculture in Taiwan.
RESEARCH
The Solution
i-Plants is connected to the soil database of the Taiwan Agricultural Research Institute, so it can examine every farmland that users want to see. "If it is not suitable for growing corn, we will advise farmers to switch to other crops." Besides, through i-Plants, farmers can also be notified about the correct harvest time so that they can prepare work early.
IDEATION
Concept Sketching
-
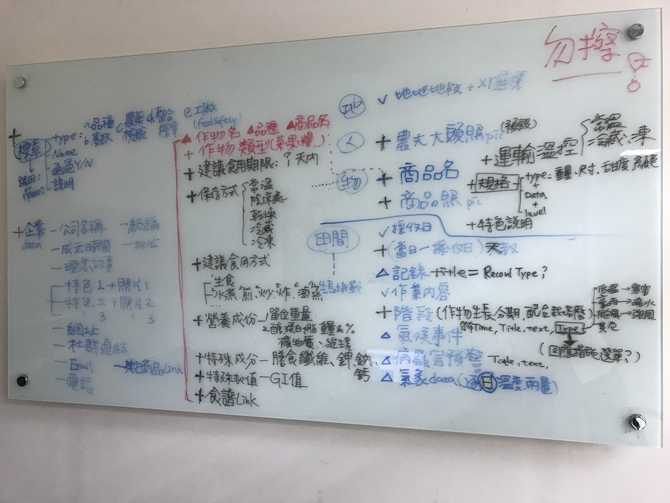
Concept Map
In the initial product development, we write down every data we can interface and requirements for stakeholders. Try to find out our features and market segmentation. We can realize how these data impact users and connect them to the needs of users.
-
-
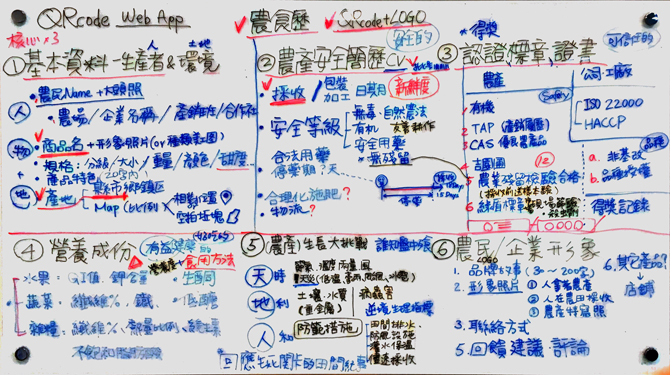
Ecosystem Diagram
In this process, we visualize every role in our ecosystem. The product not only impact farmer, agribusiness, and consumer, but also impact the certification body and package factory. Illustrating the conceptual relationship between various system touchpoints, therefore, the product is gradually formed.
-
-
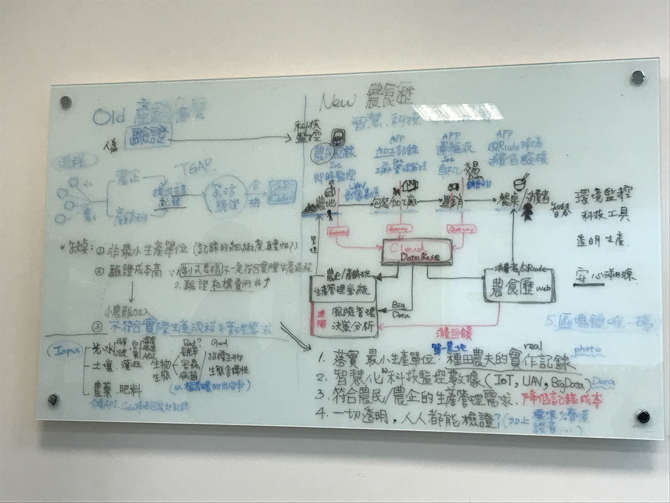
Process Flow Diagram
After we figure out the desire for each role, then we can start to think about the database and how to integrate it. By drawing affinity diagram, we understand the relationship between the data we need. Then we can construct the outline of our product.
-
-
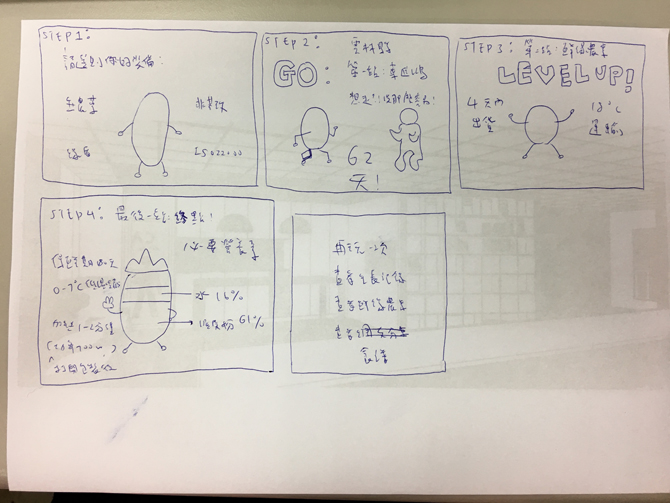
Storyboarding
After the analysis of data, it is time to design. We disassemble each user in our ecosystem and try to research the contextual of using. By implementing our research, we are using the storyboarding to make sure the usability. This is one of the examples that I try to use the game interface to attract our farmers to record the cultivation process.
-
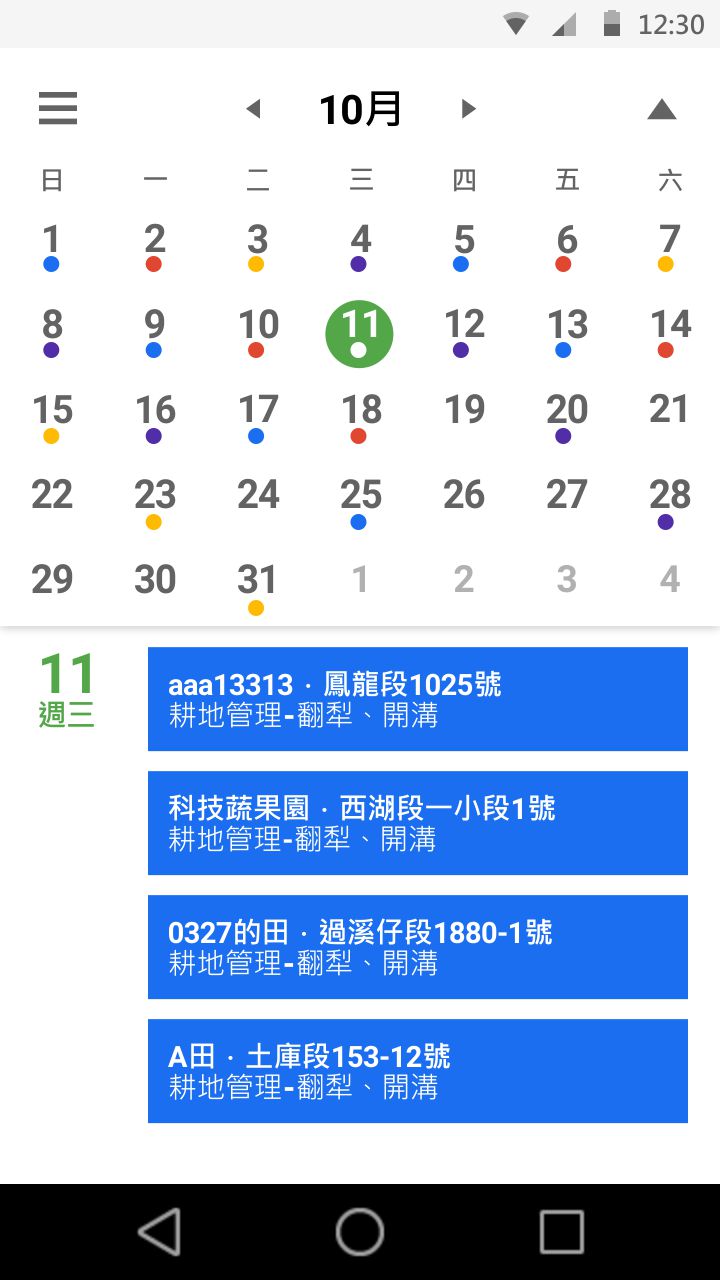
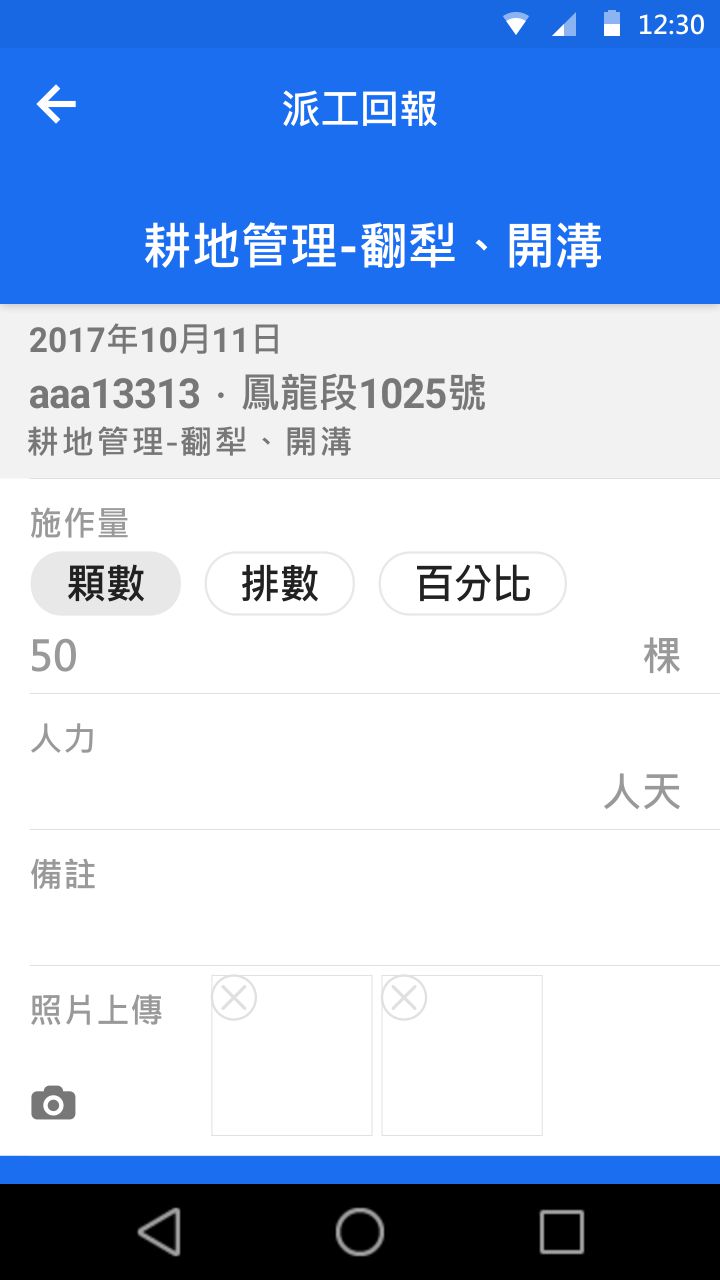
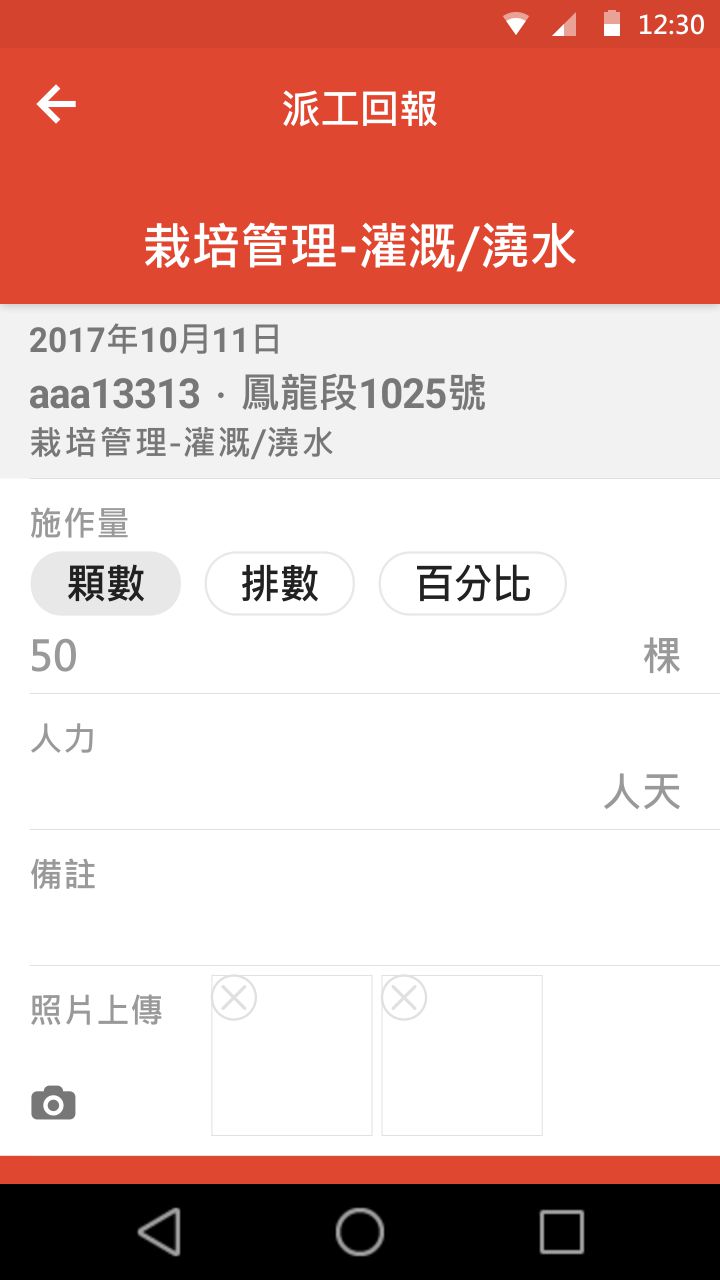
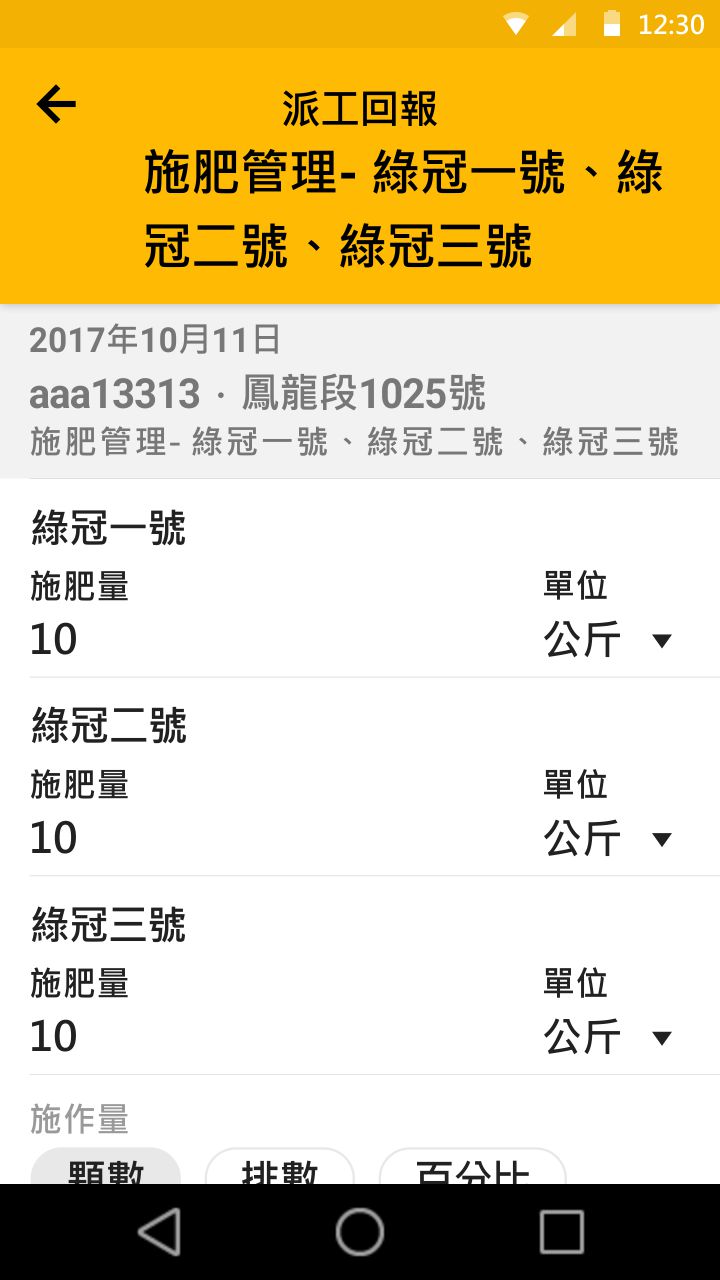
HIGH FIDELITY DESIGN
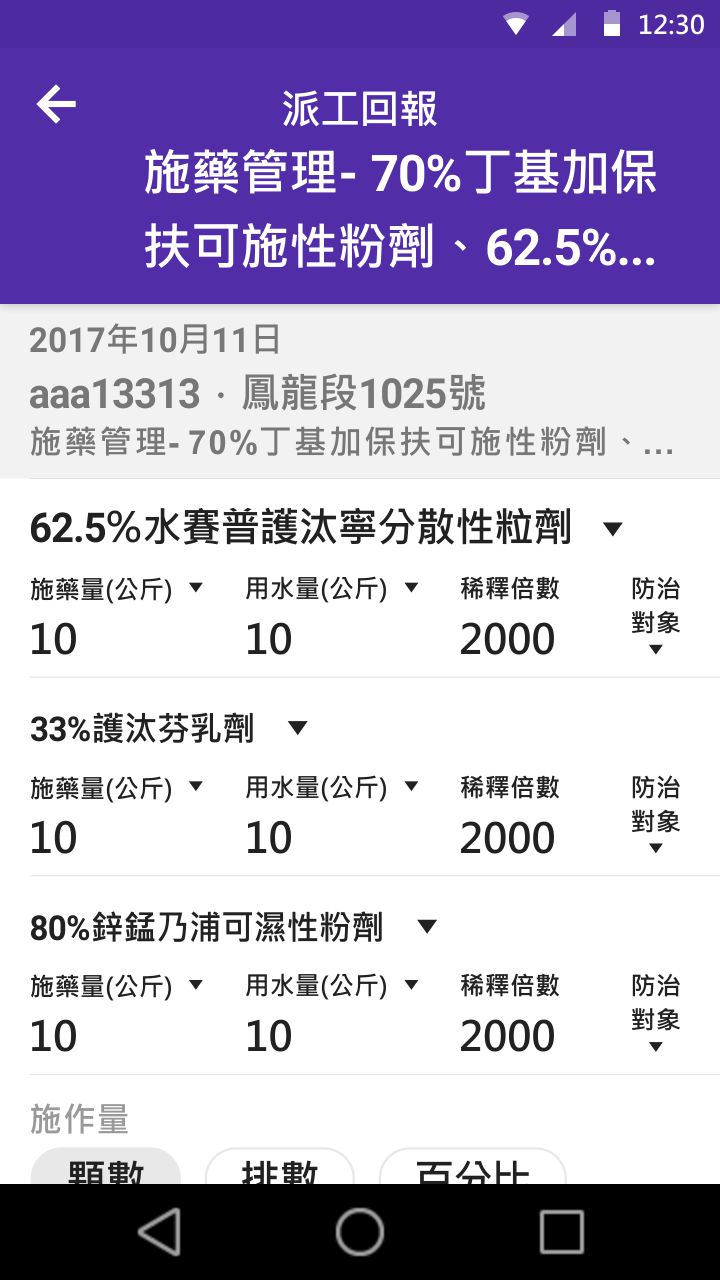
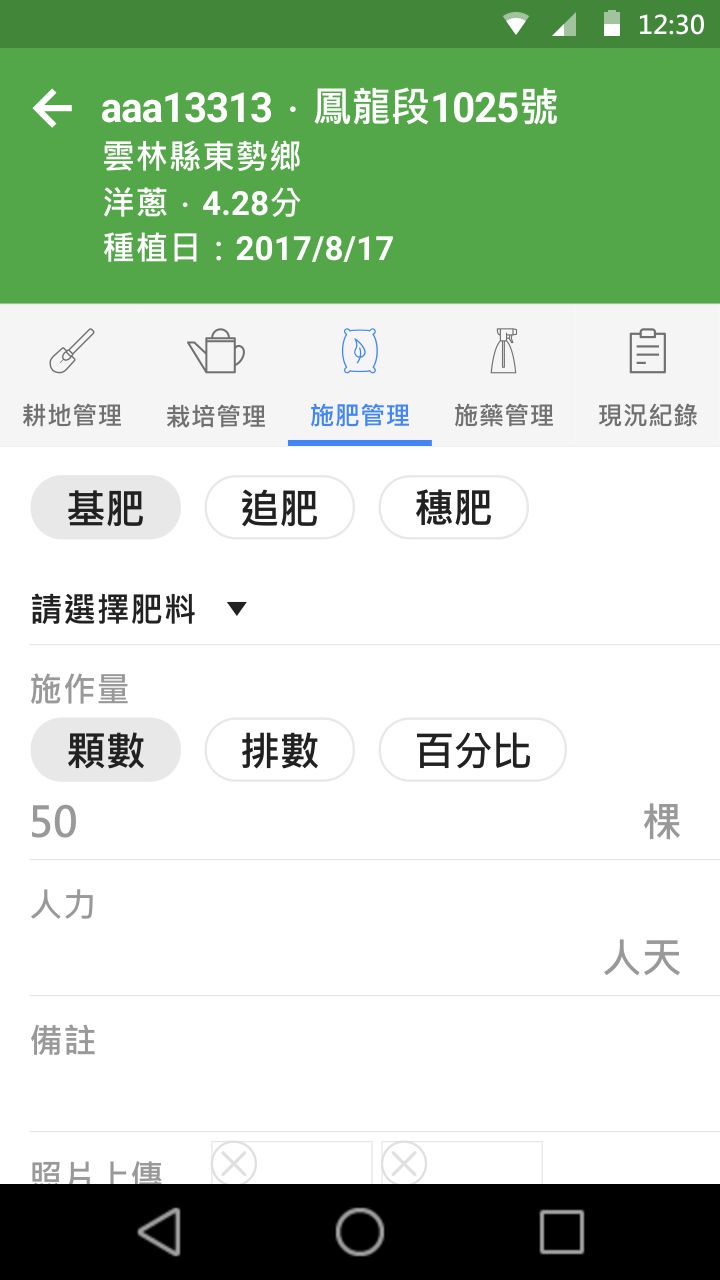
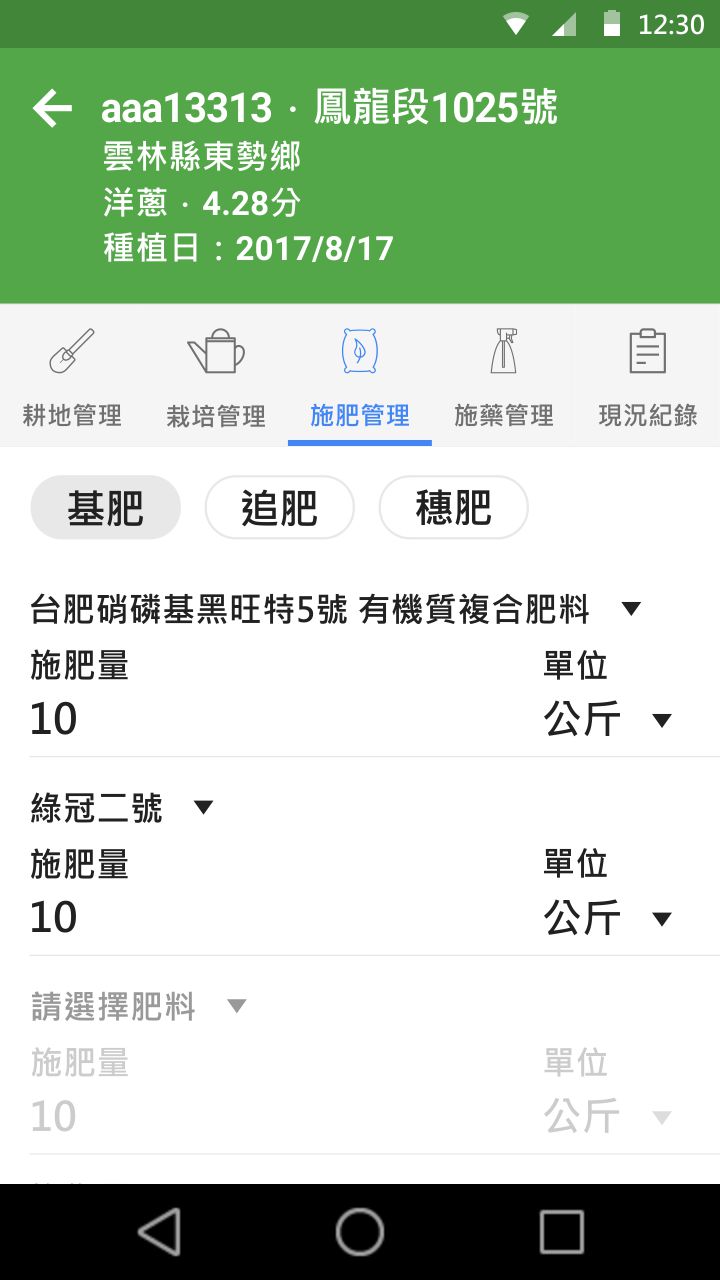
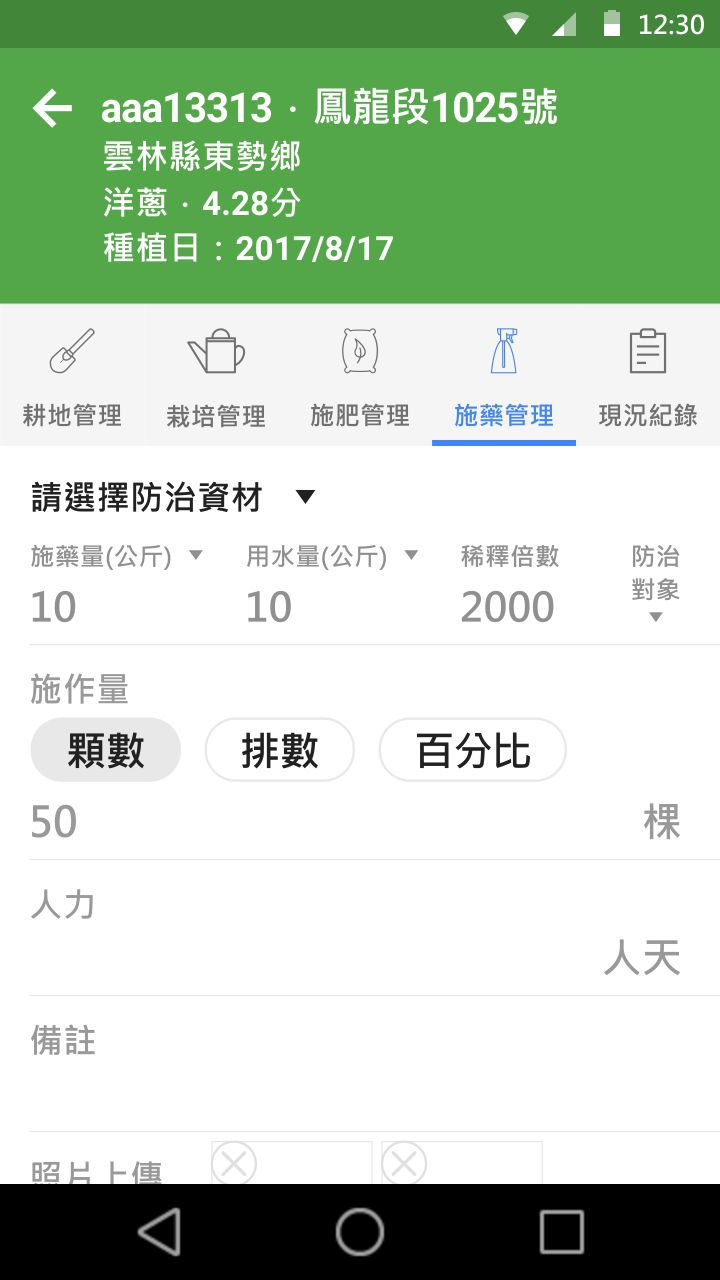
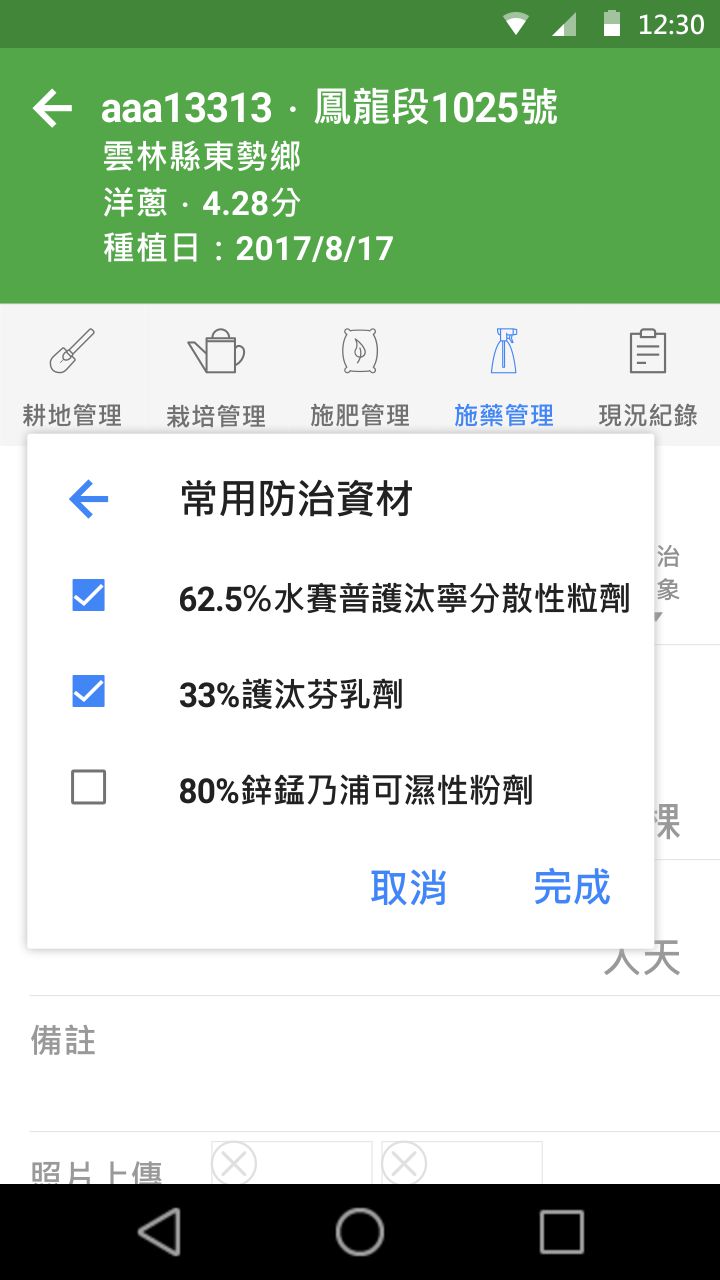
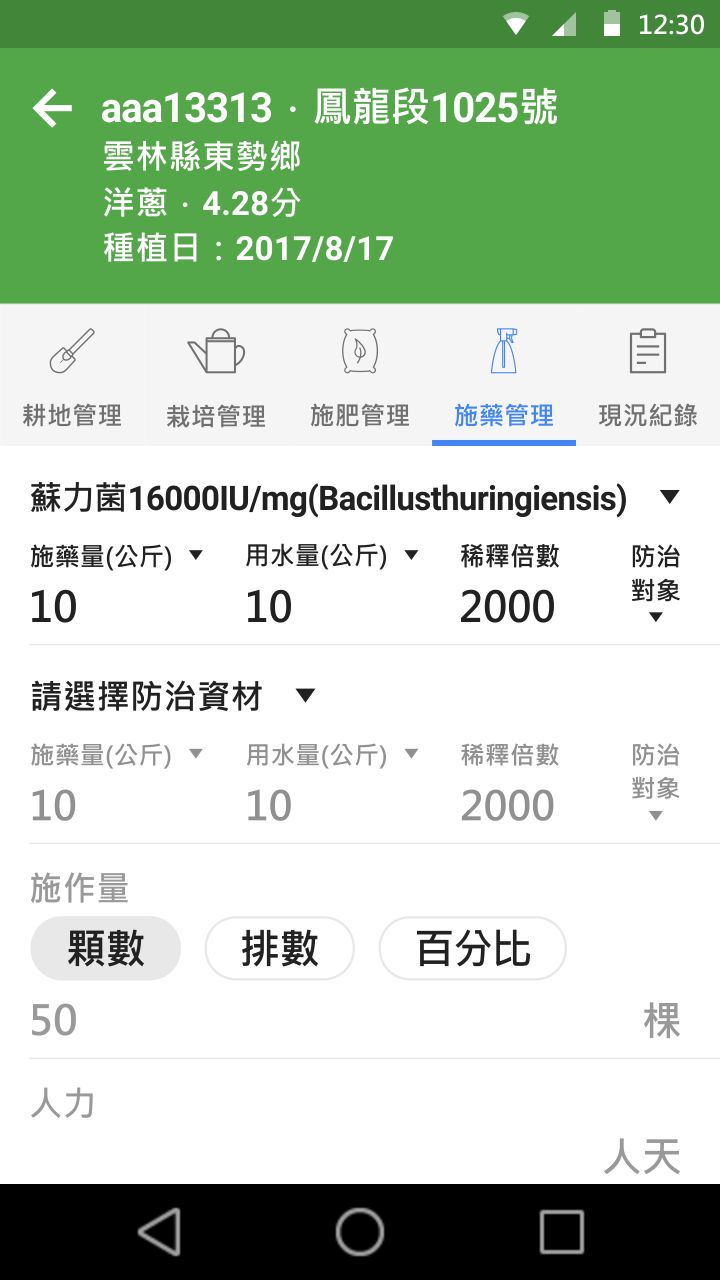
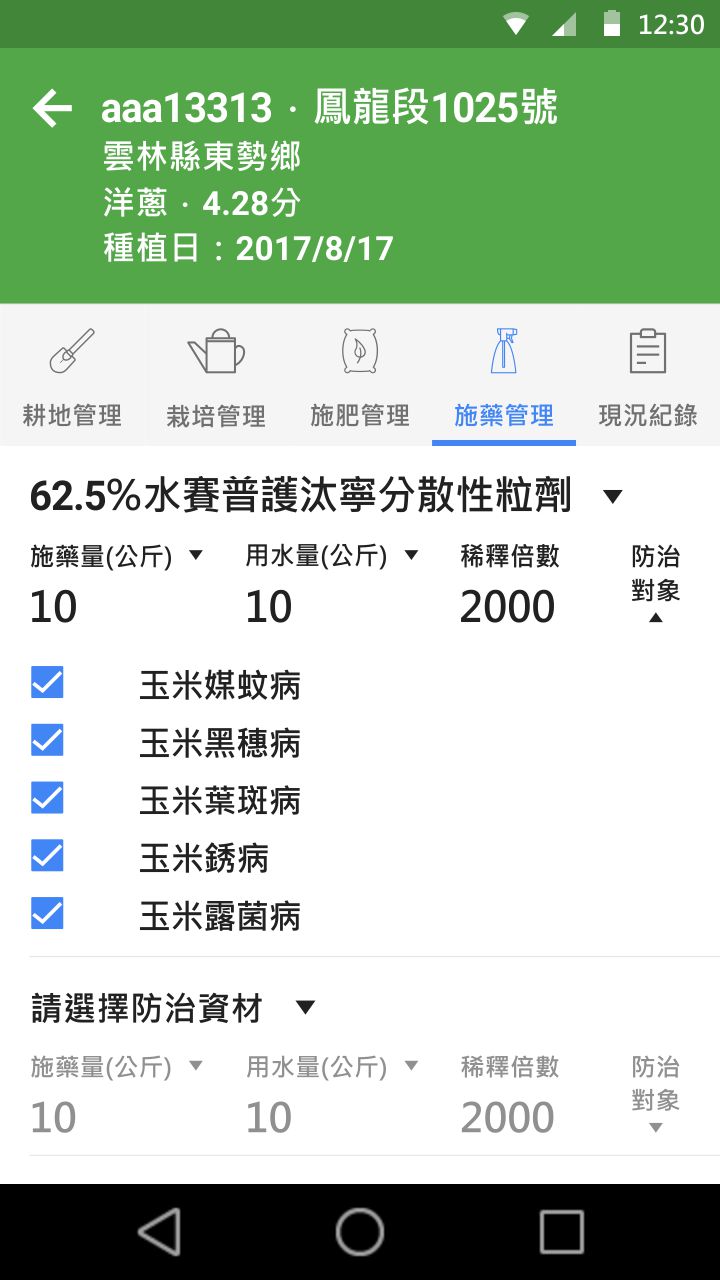
Prototyping for Farmer
Our client Great Agriculture Co., Ltd., started to use i-Plants for managing corn production last year. Its corn production area is more than 500 hectares, with a total of more than 100 farmers. In order to use the i-Plants system, they all equipped with a tablet, not only to manage diseases and insect pests early, but also to manage soil conditions and achieve quality control.
The record data using i-Plants to record can not be changed once uploaded, which is usually written with paper and pen in the past. i-Plants can be plugged in with further function like order system, and become a one-stop service.

HIGH FIDELITY DESIGN
Prototyping for Consumer
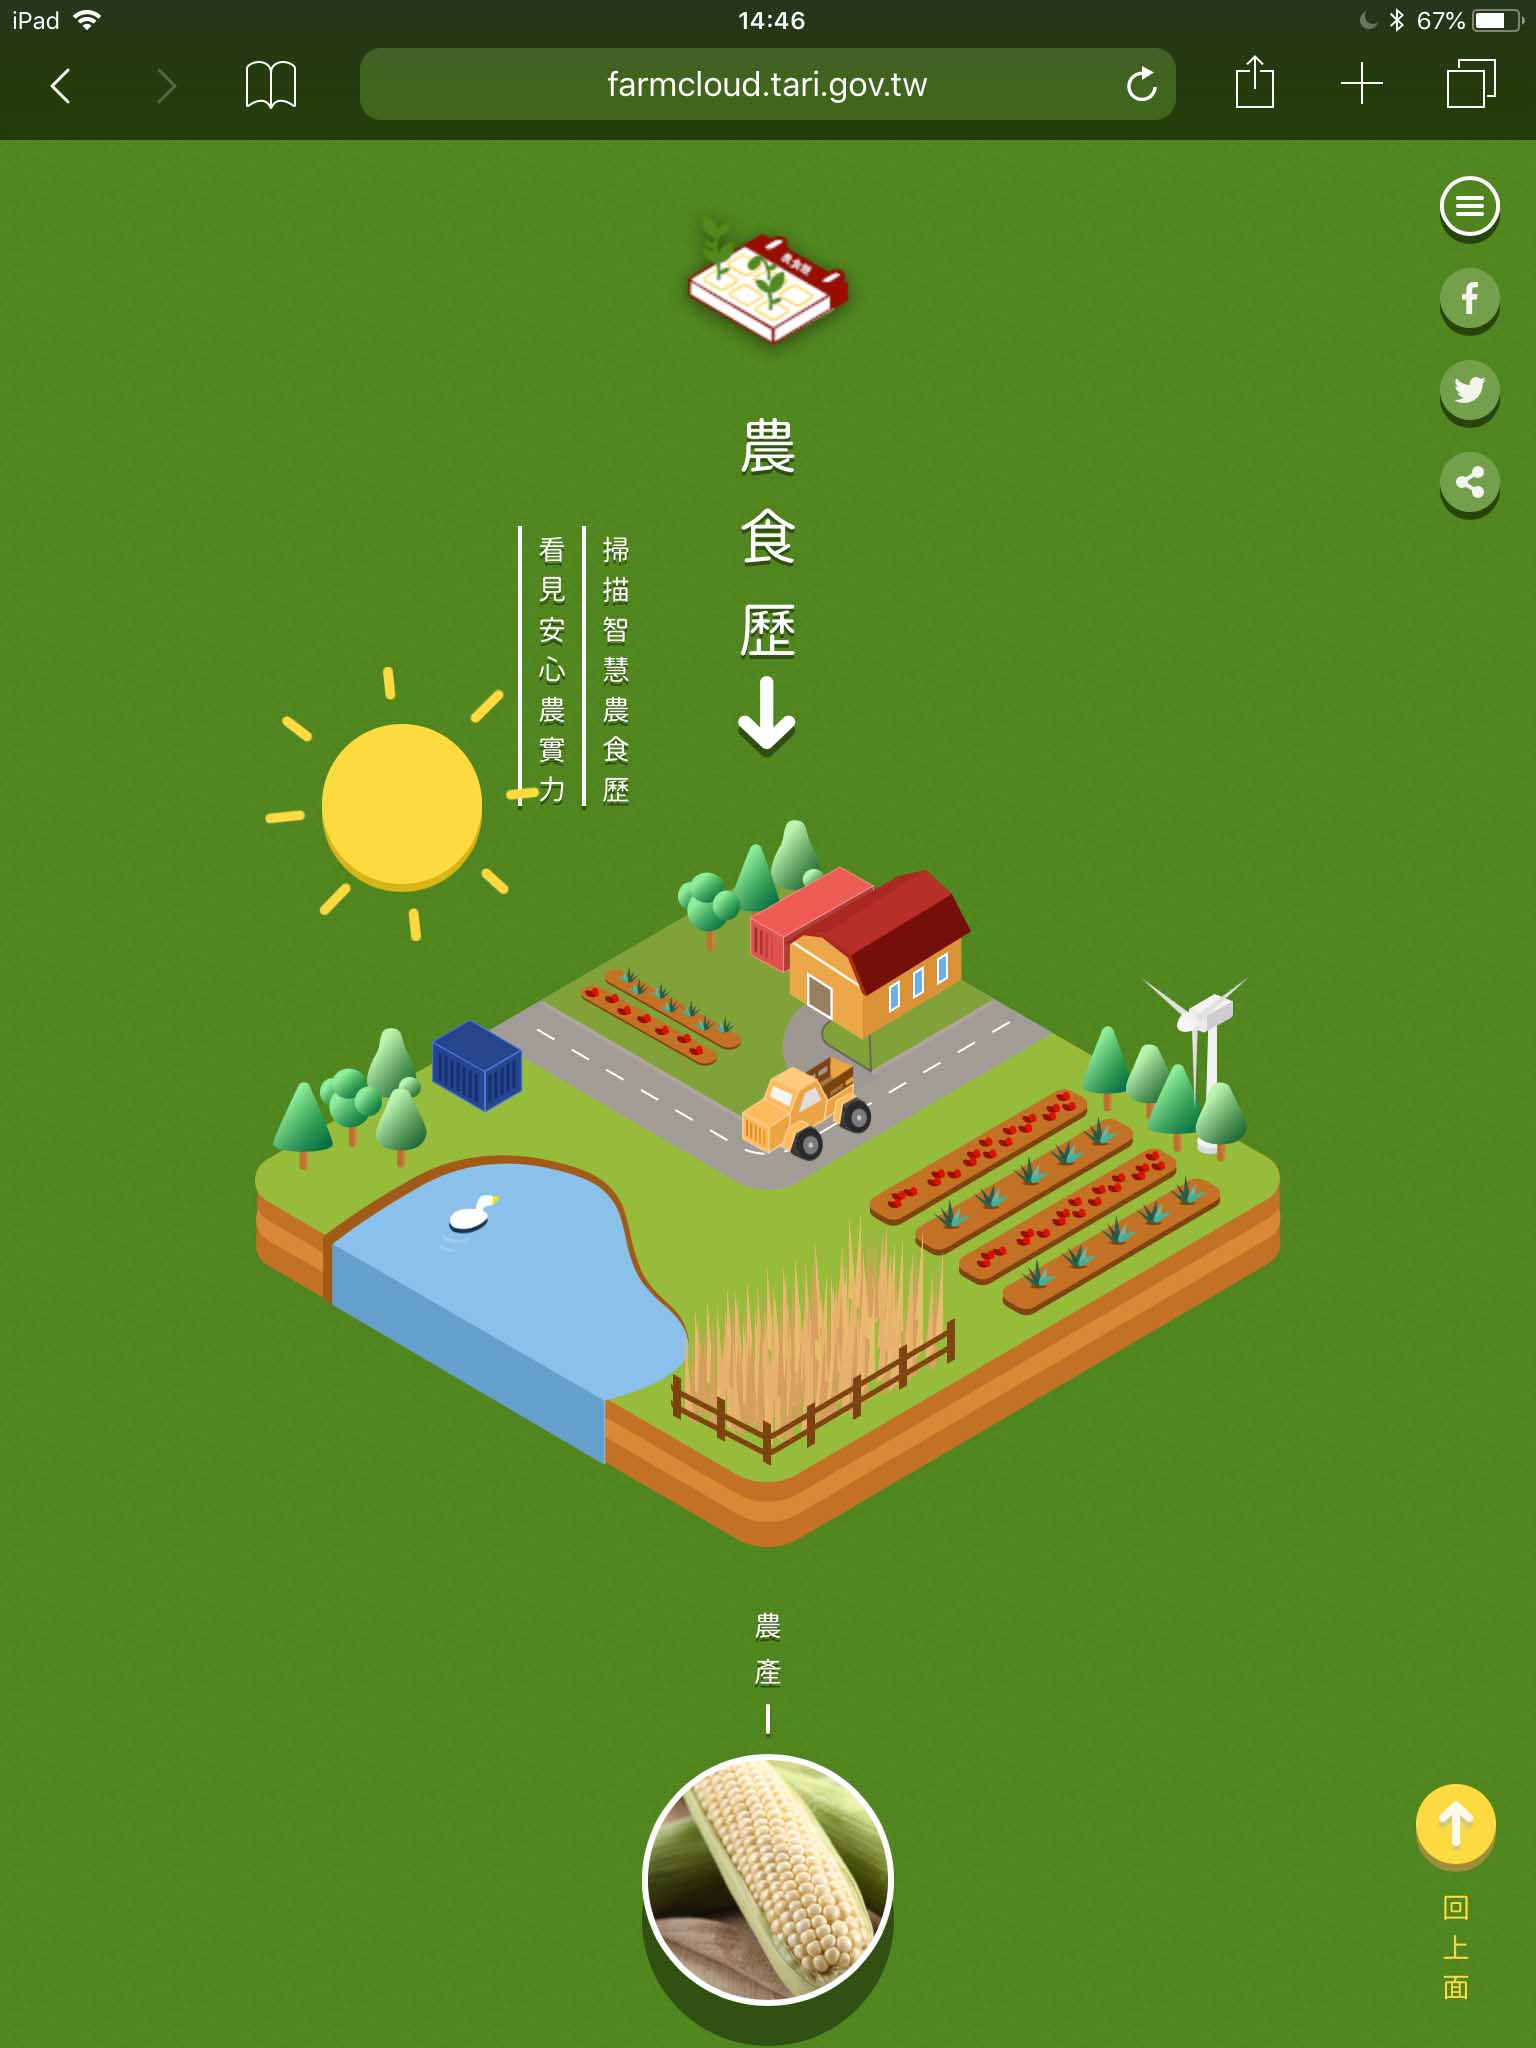
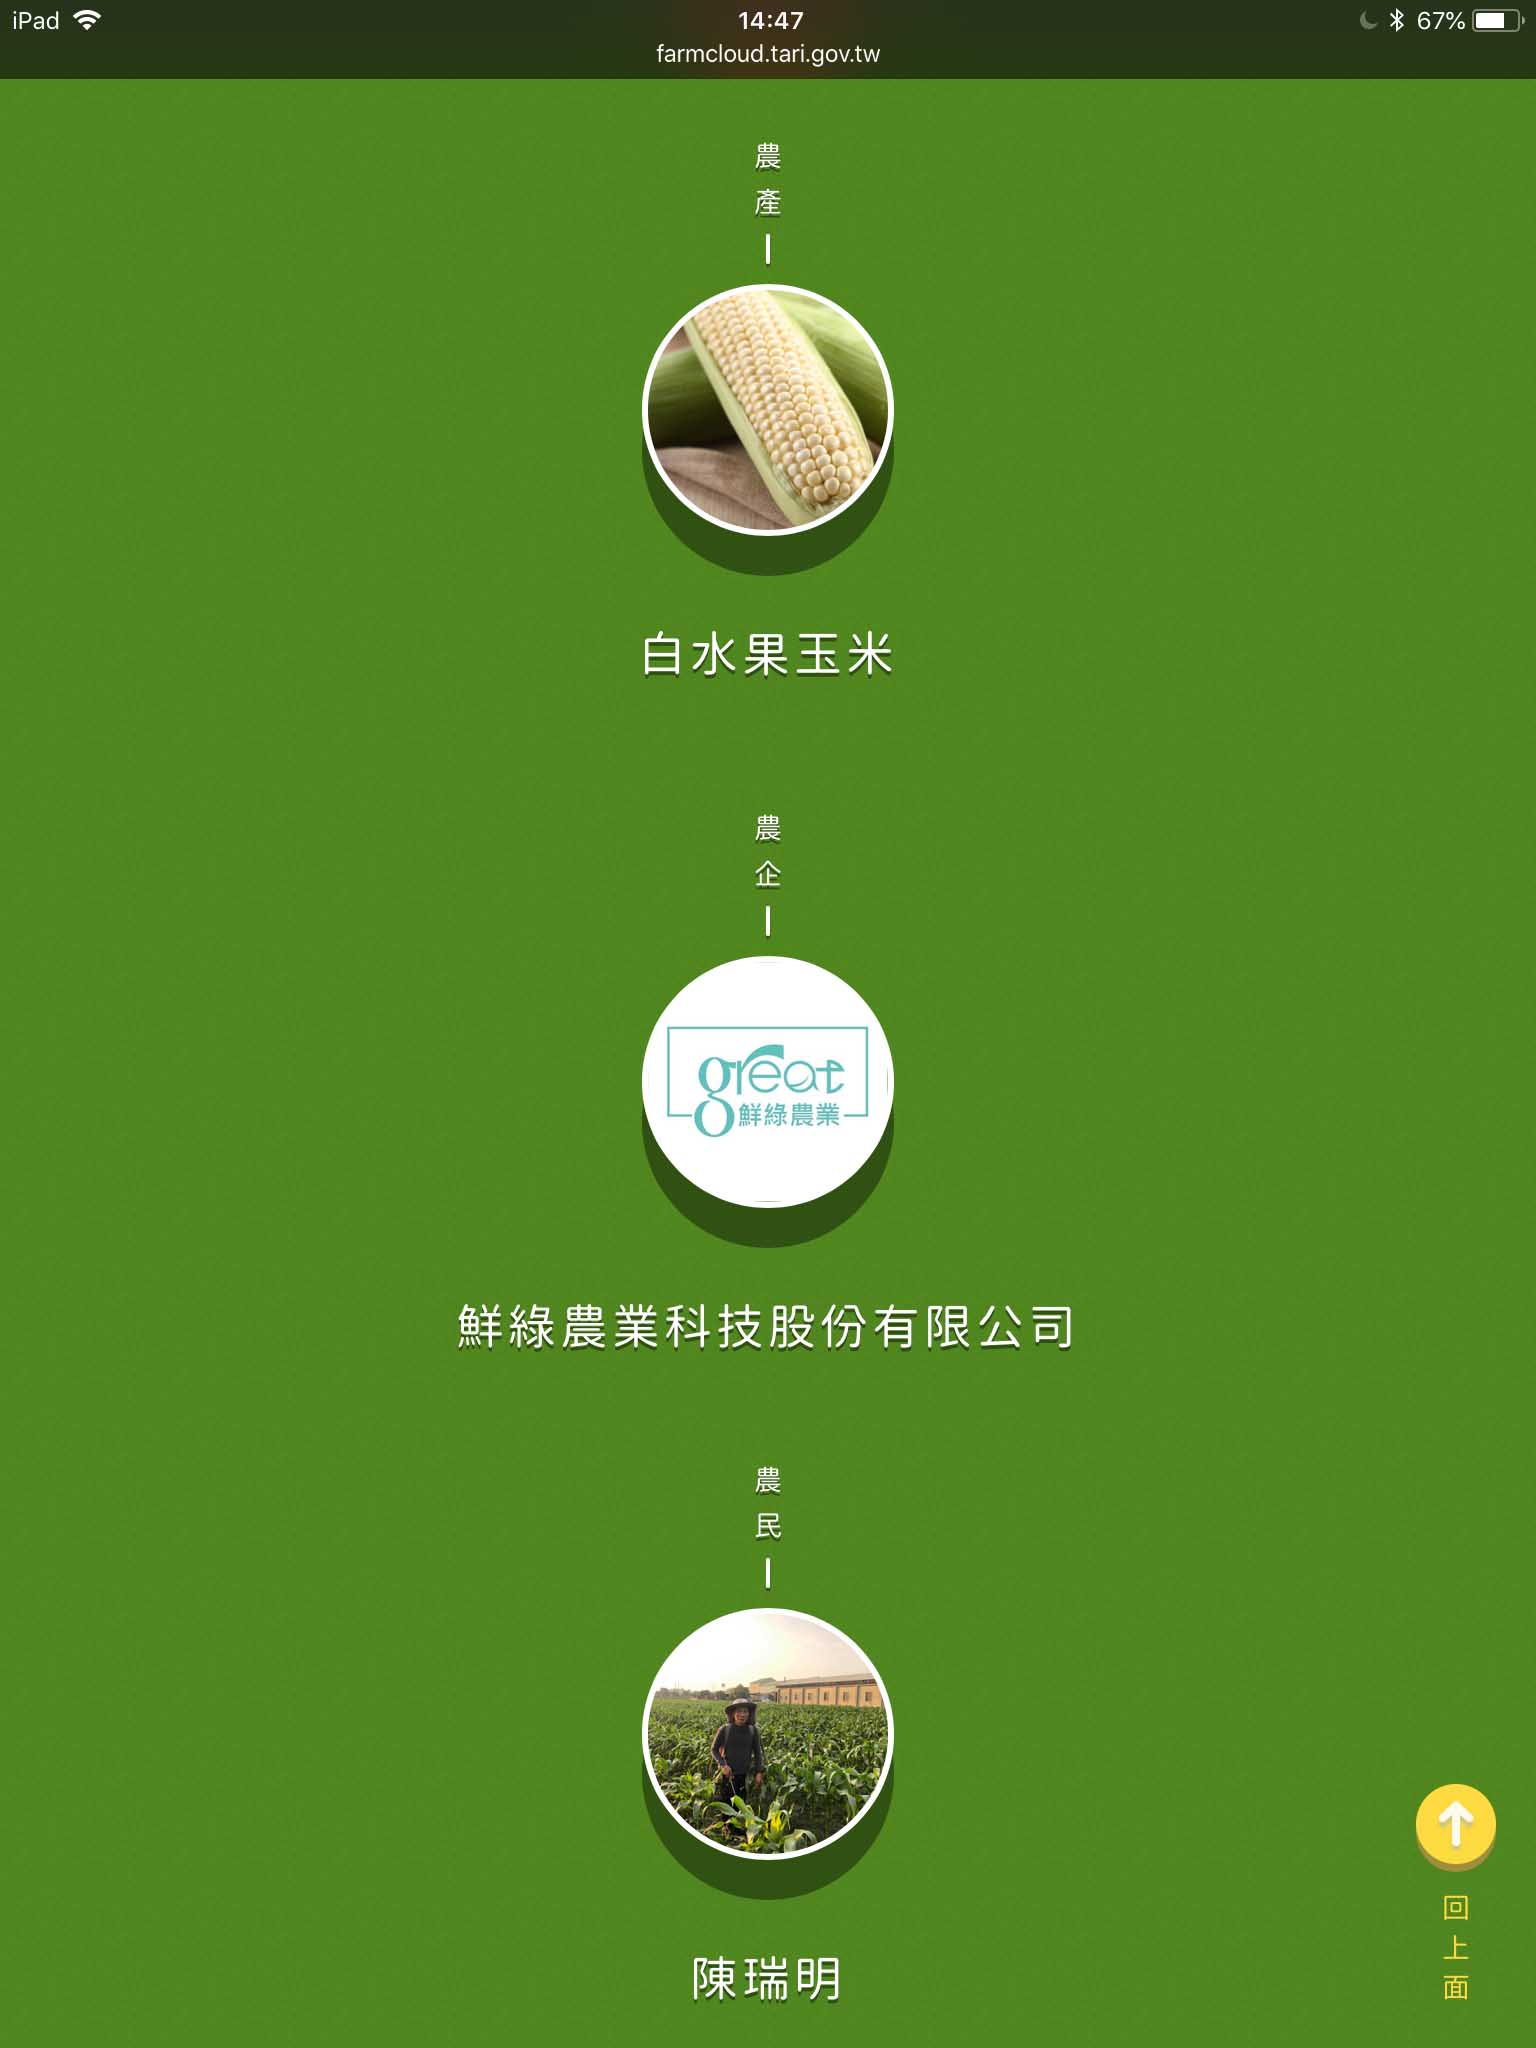
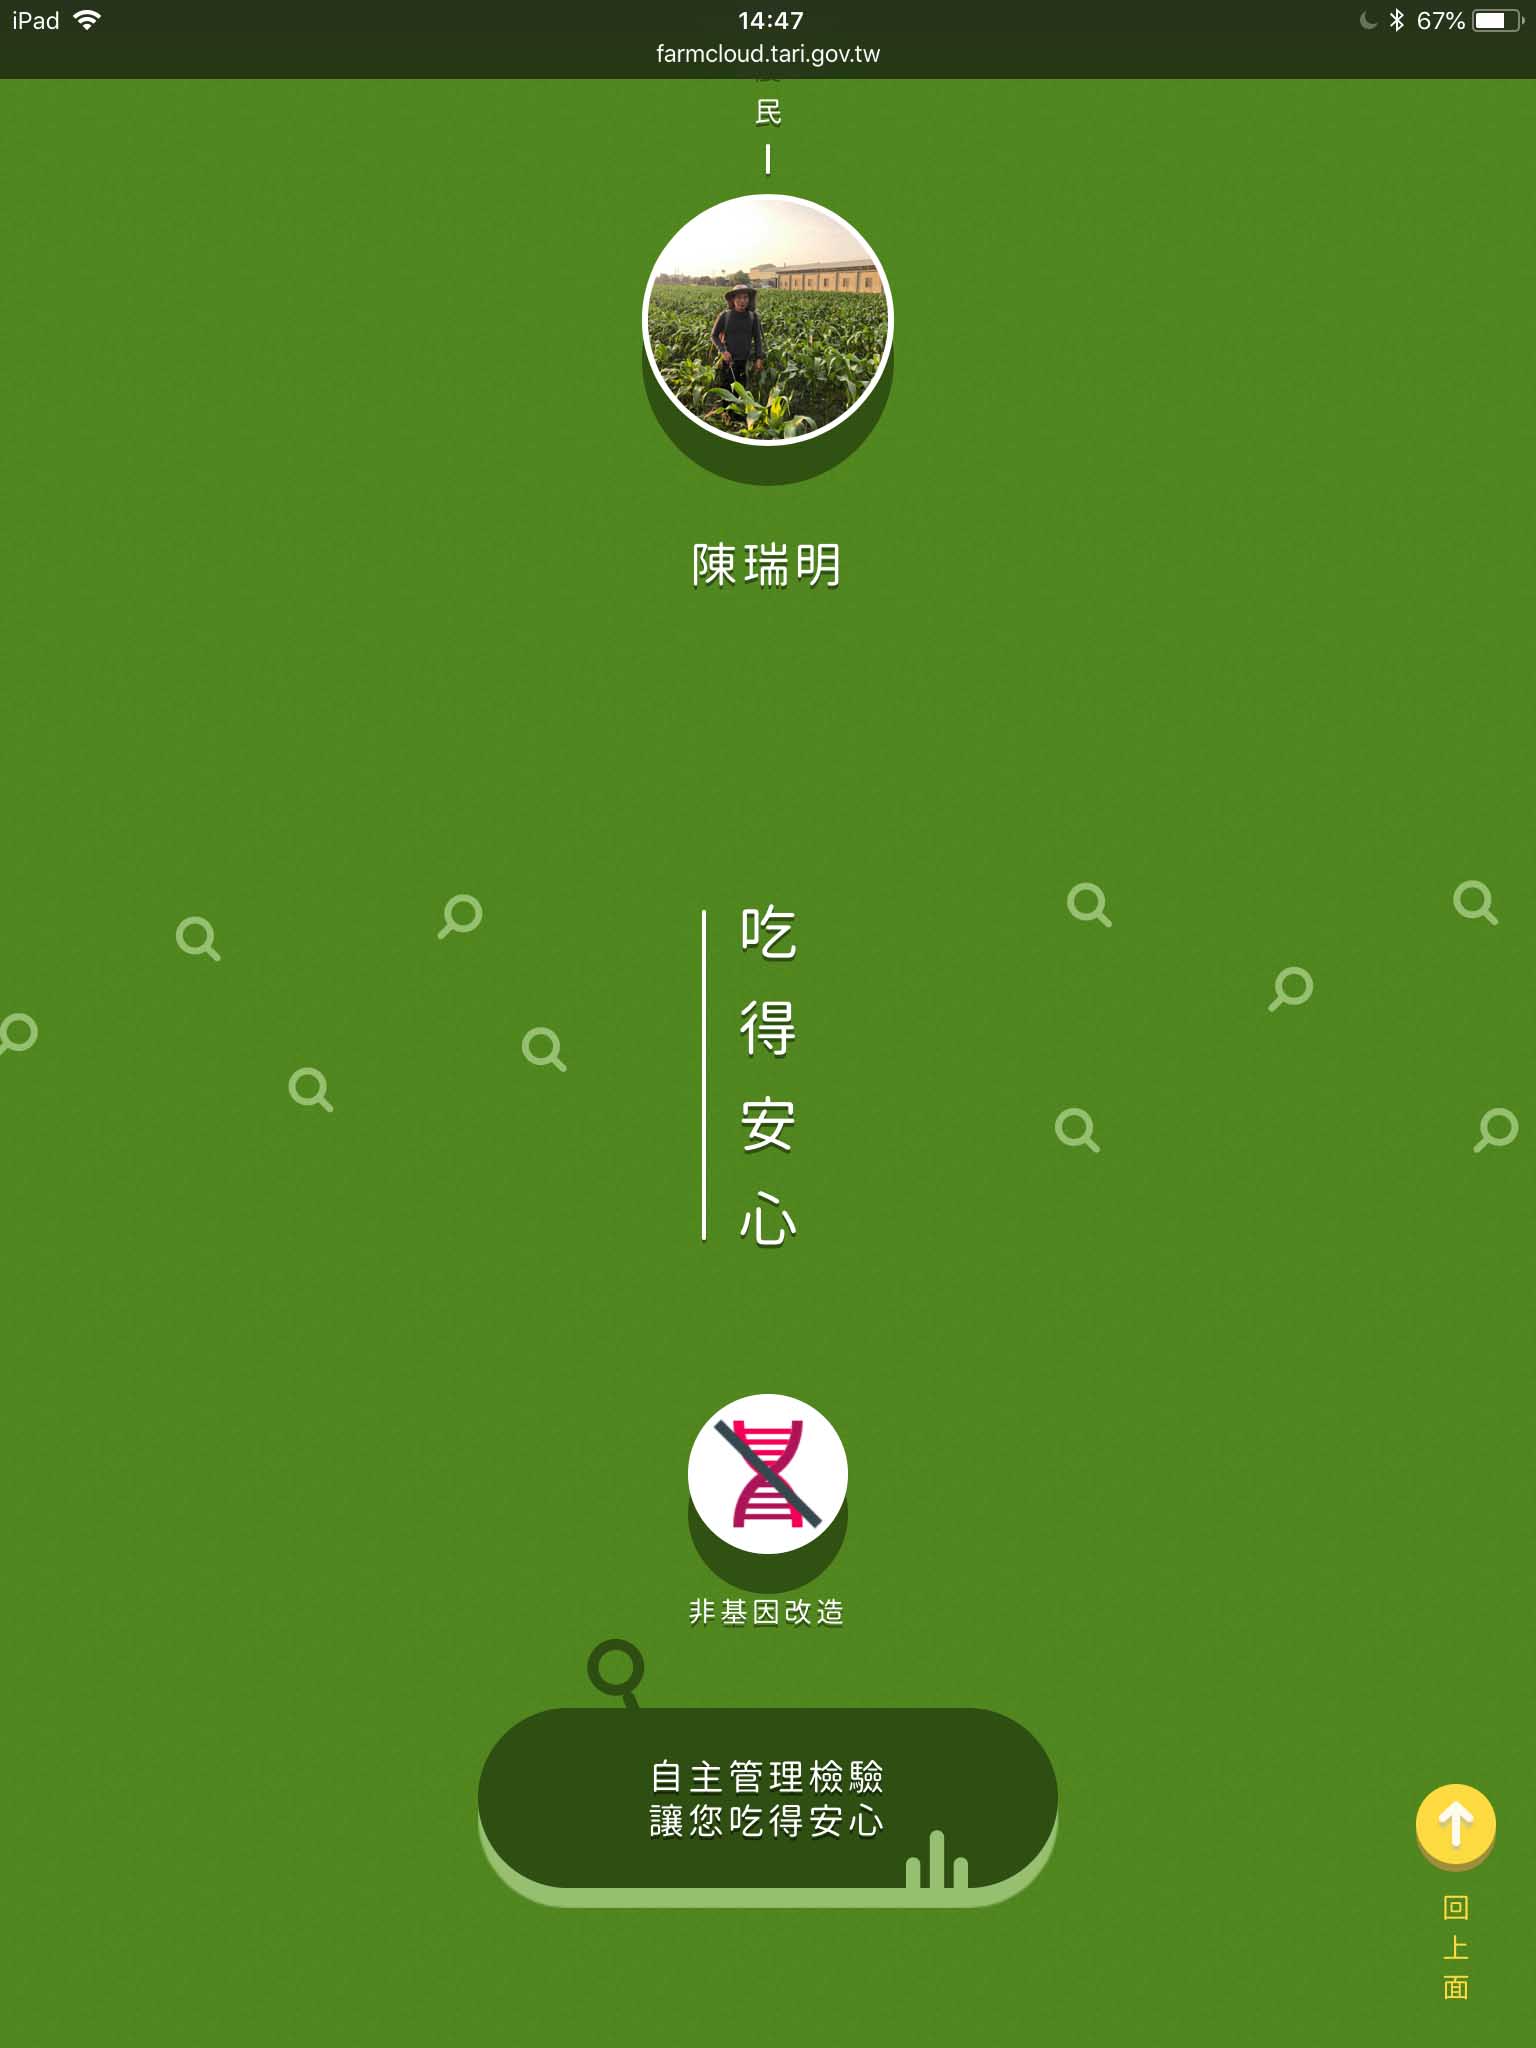
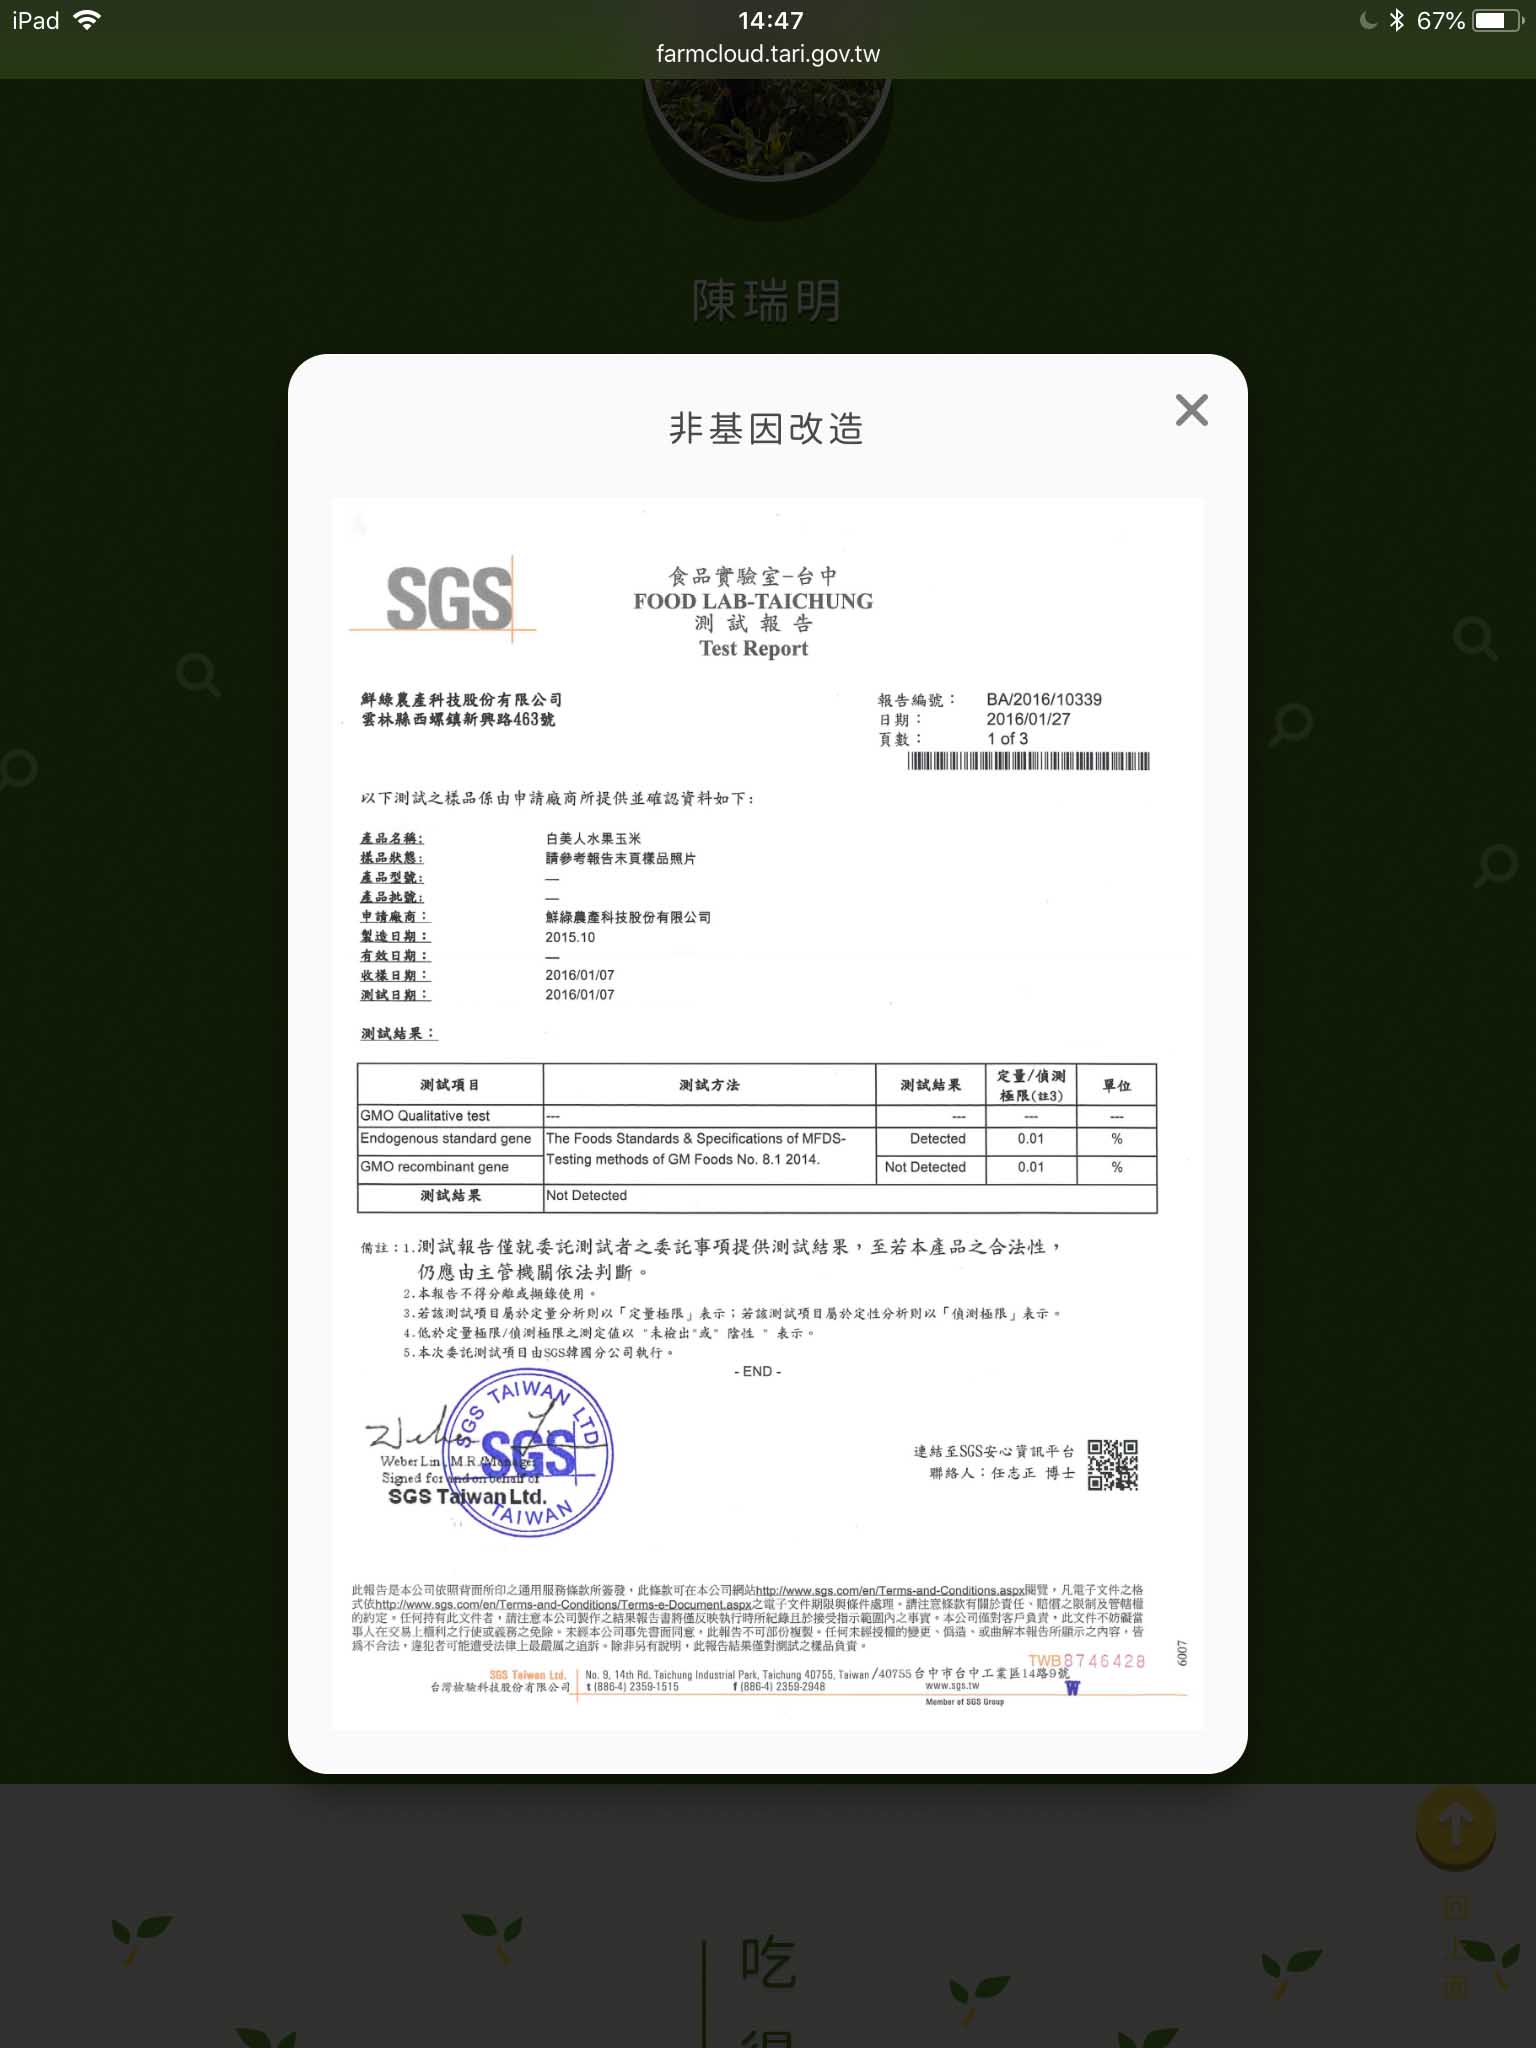
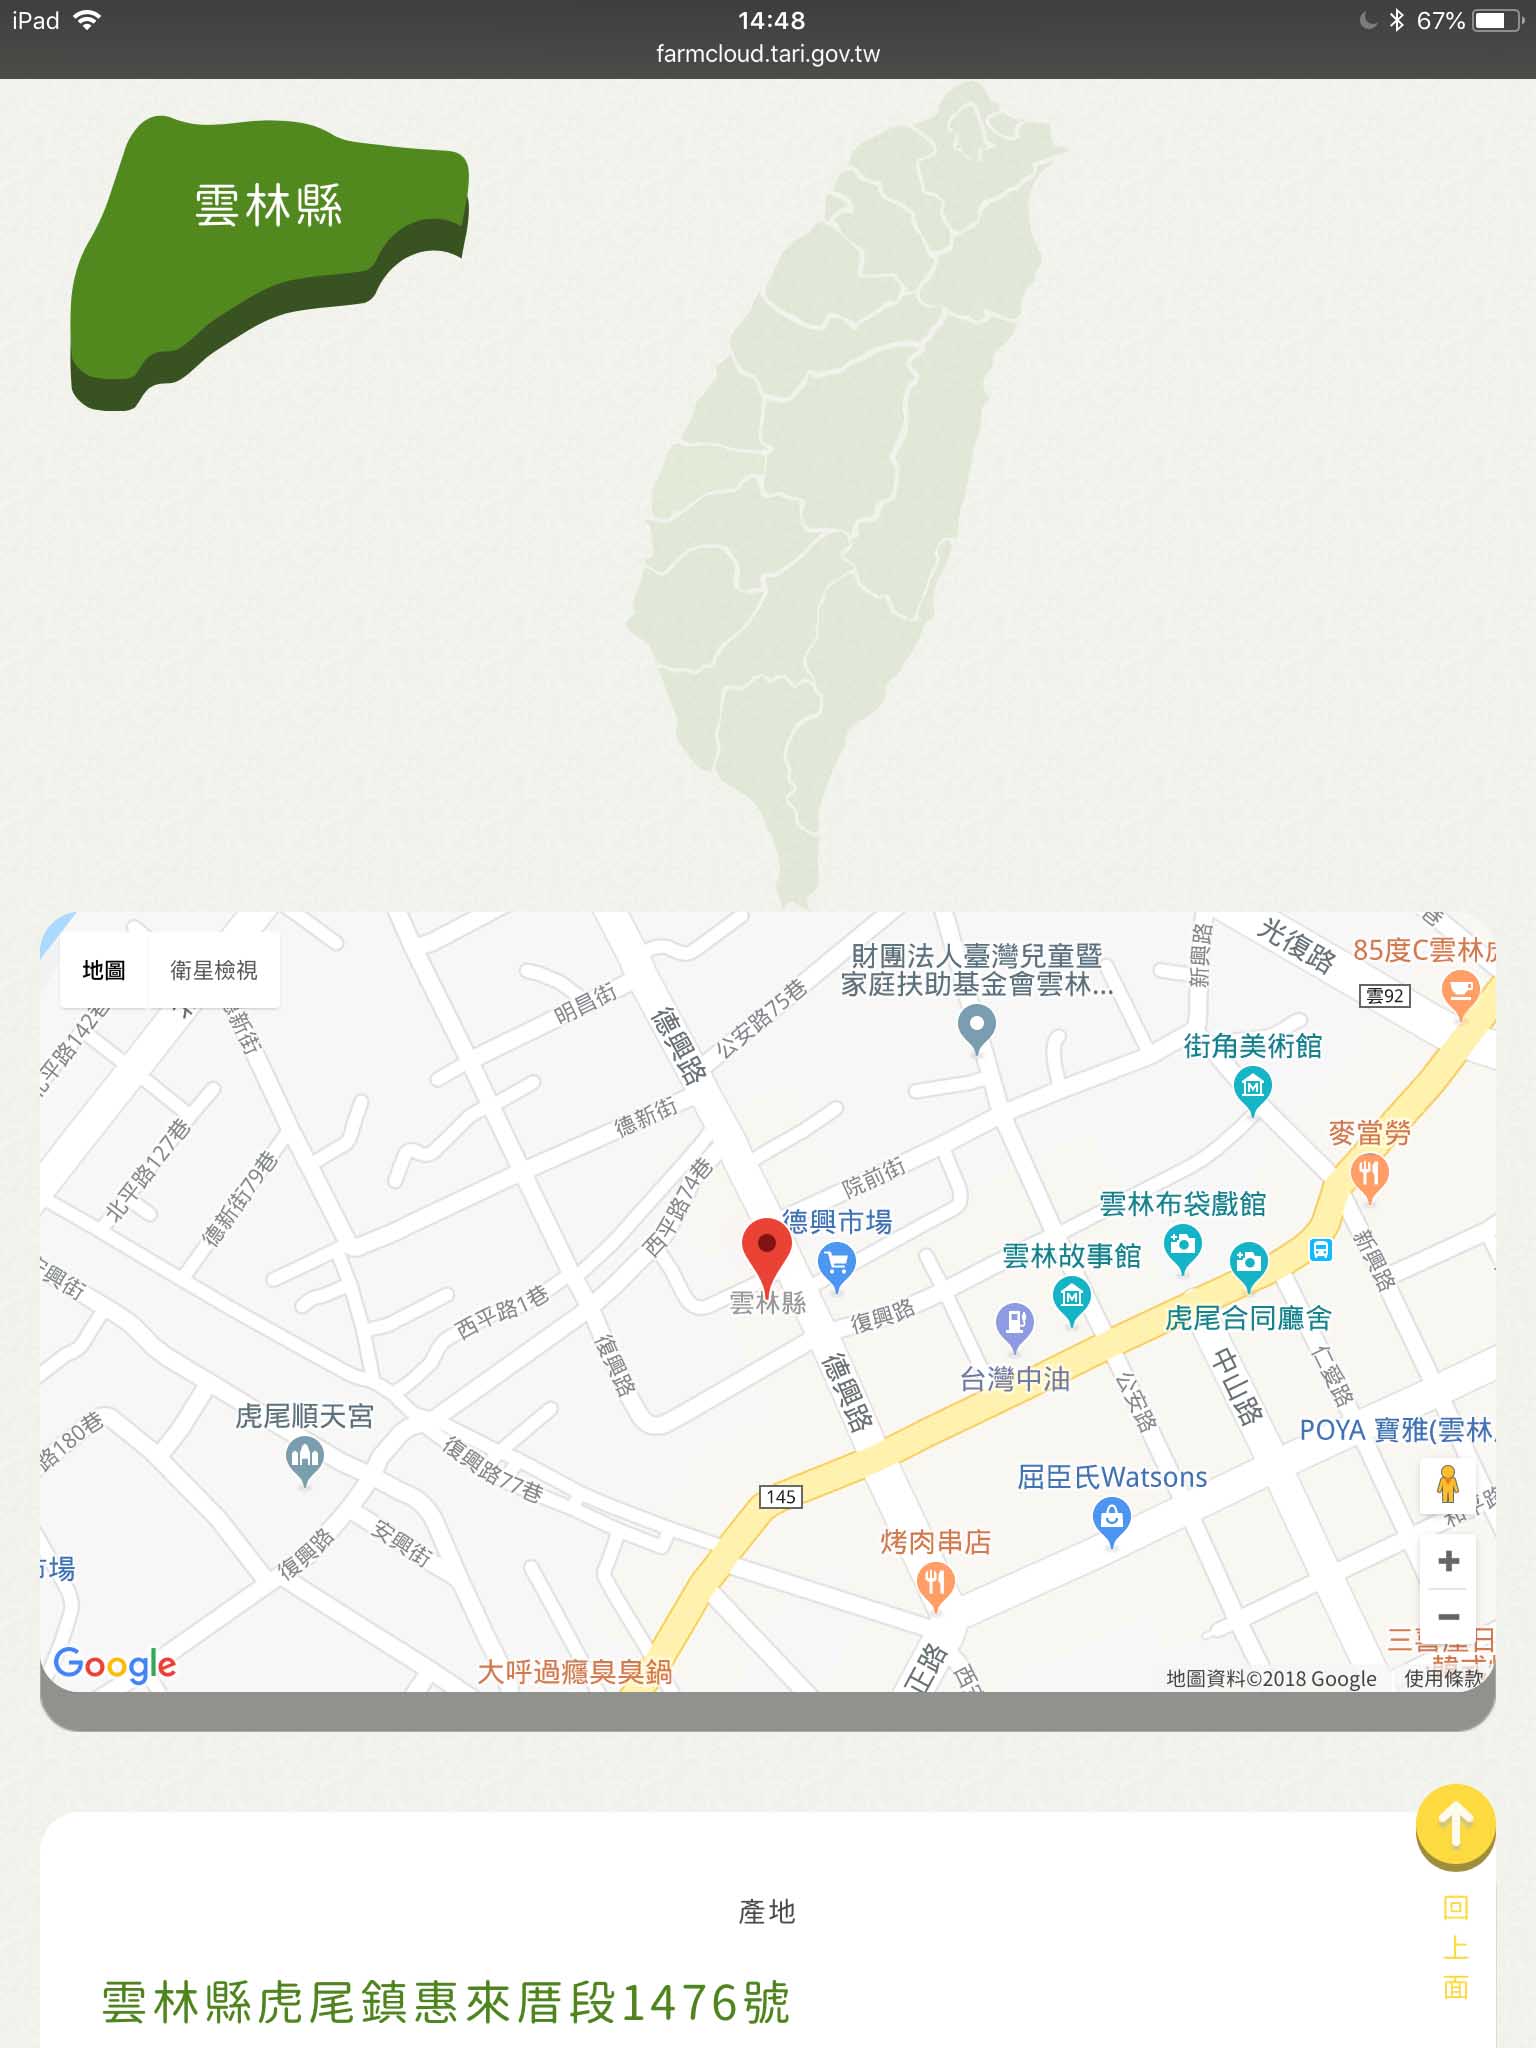
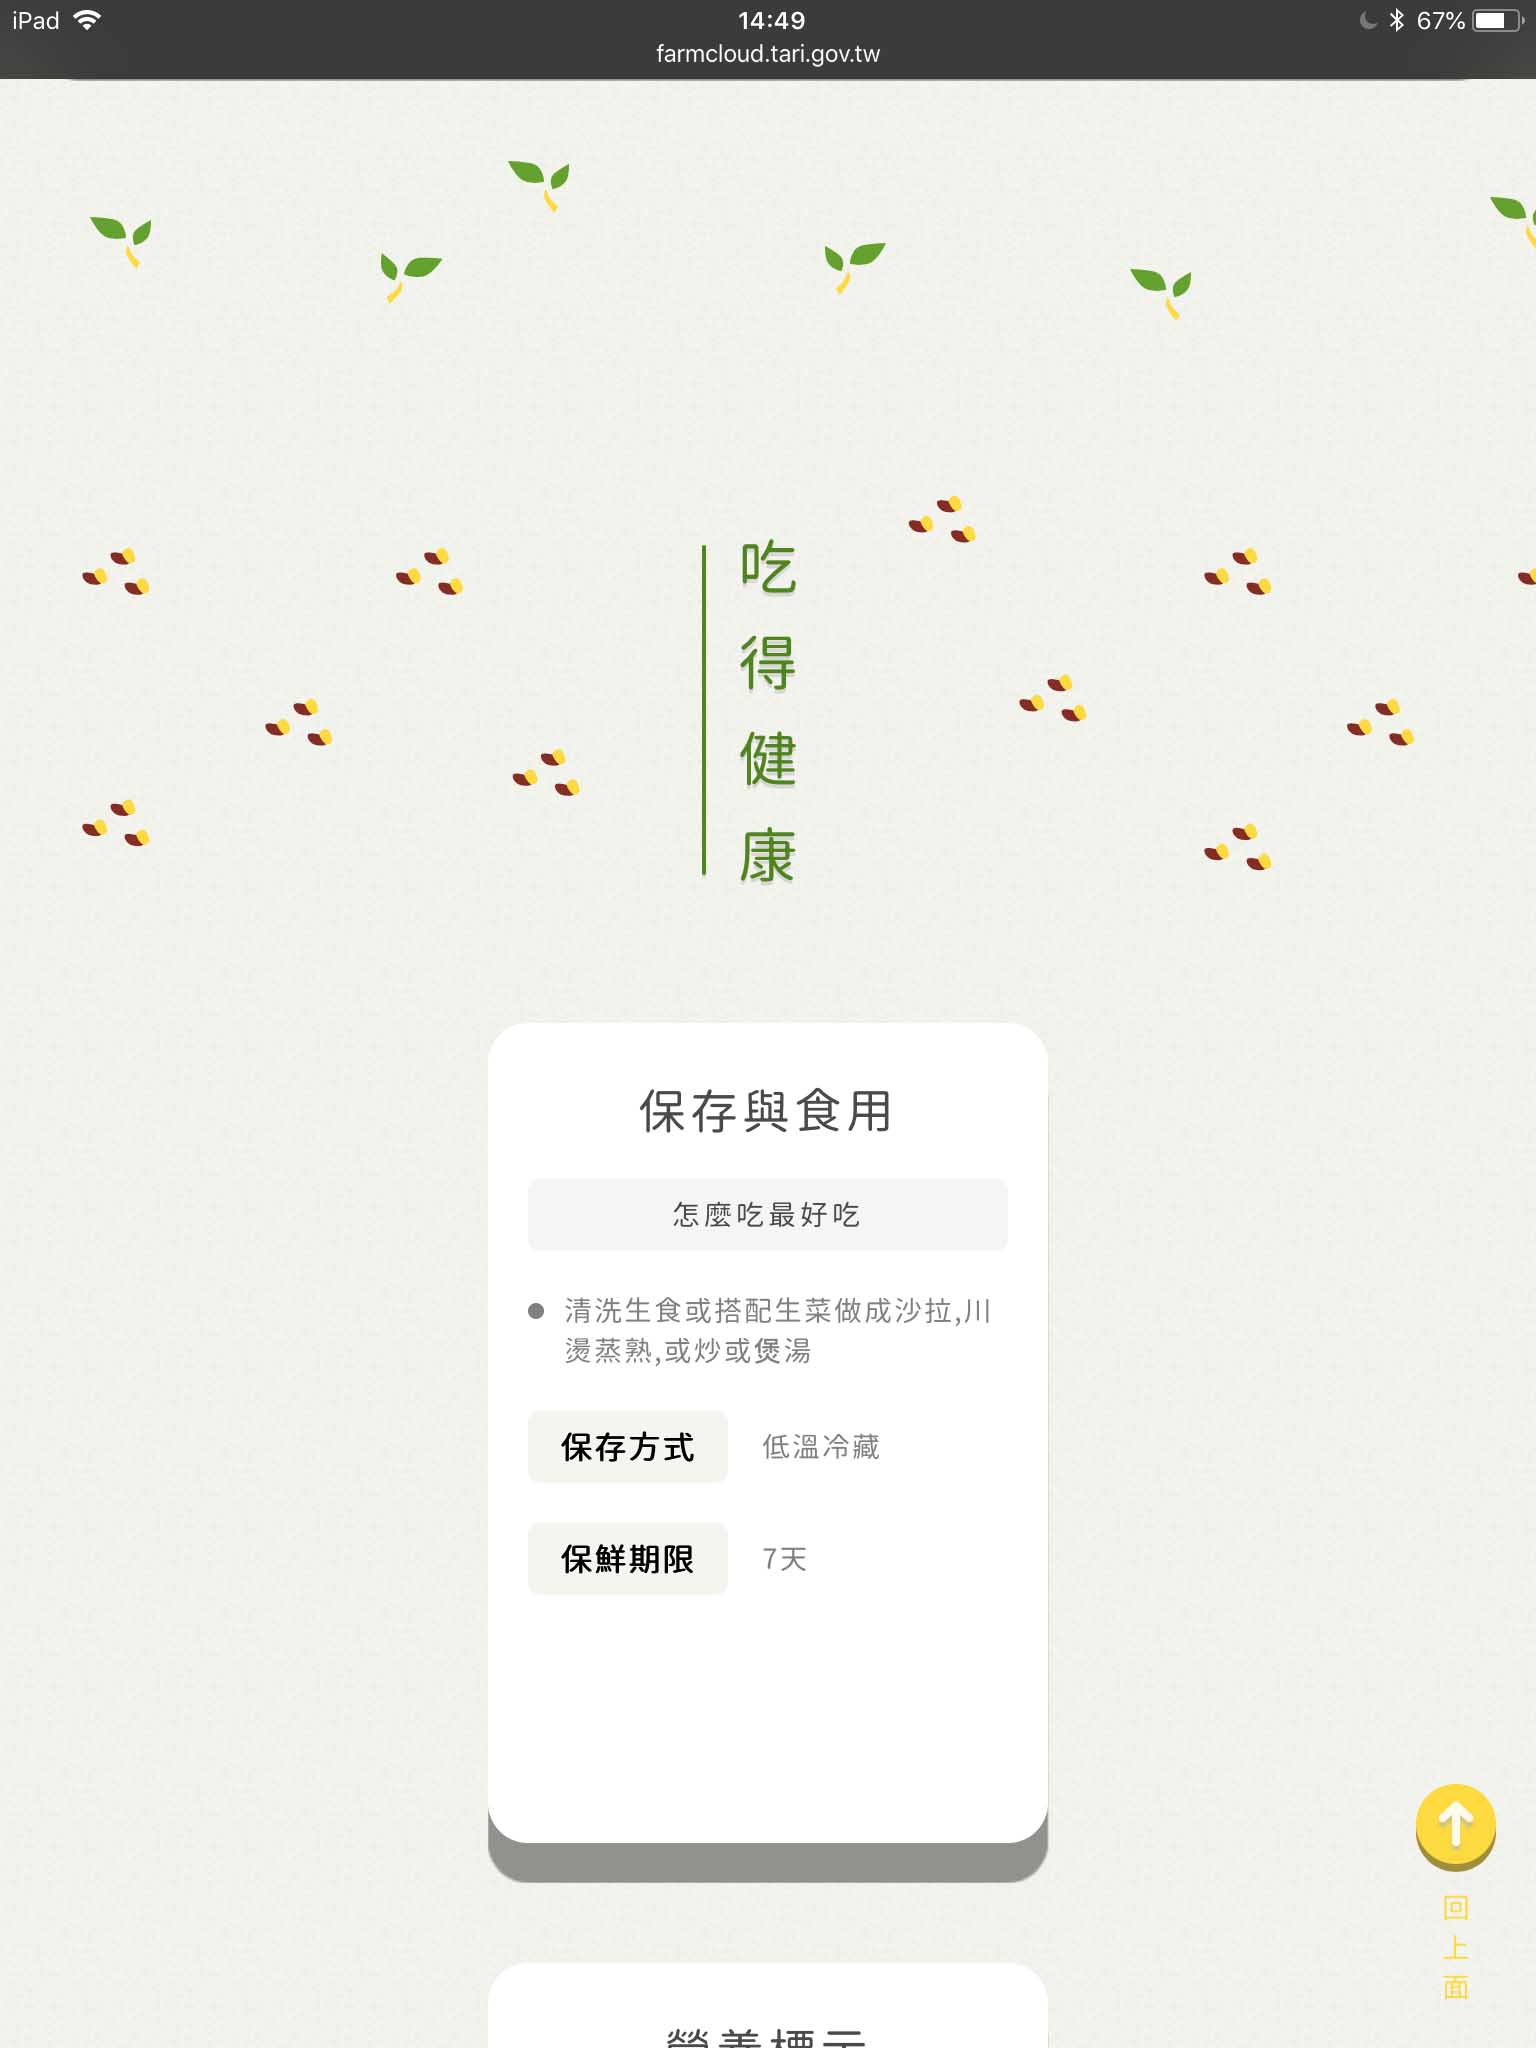
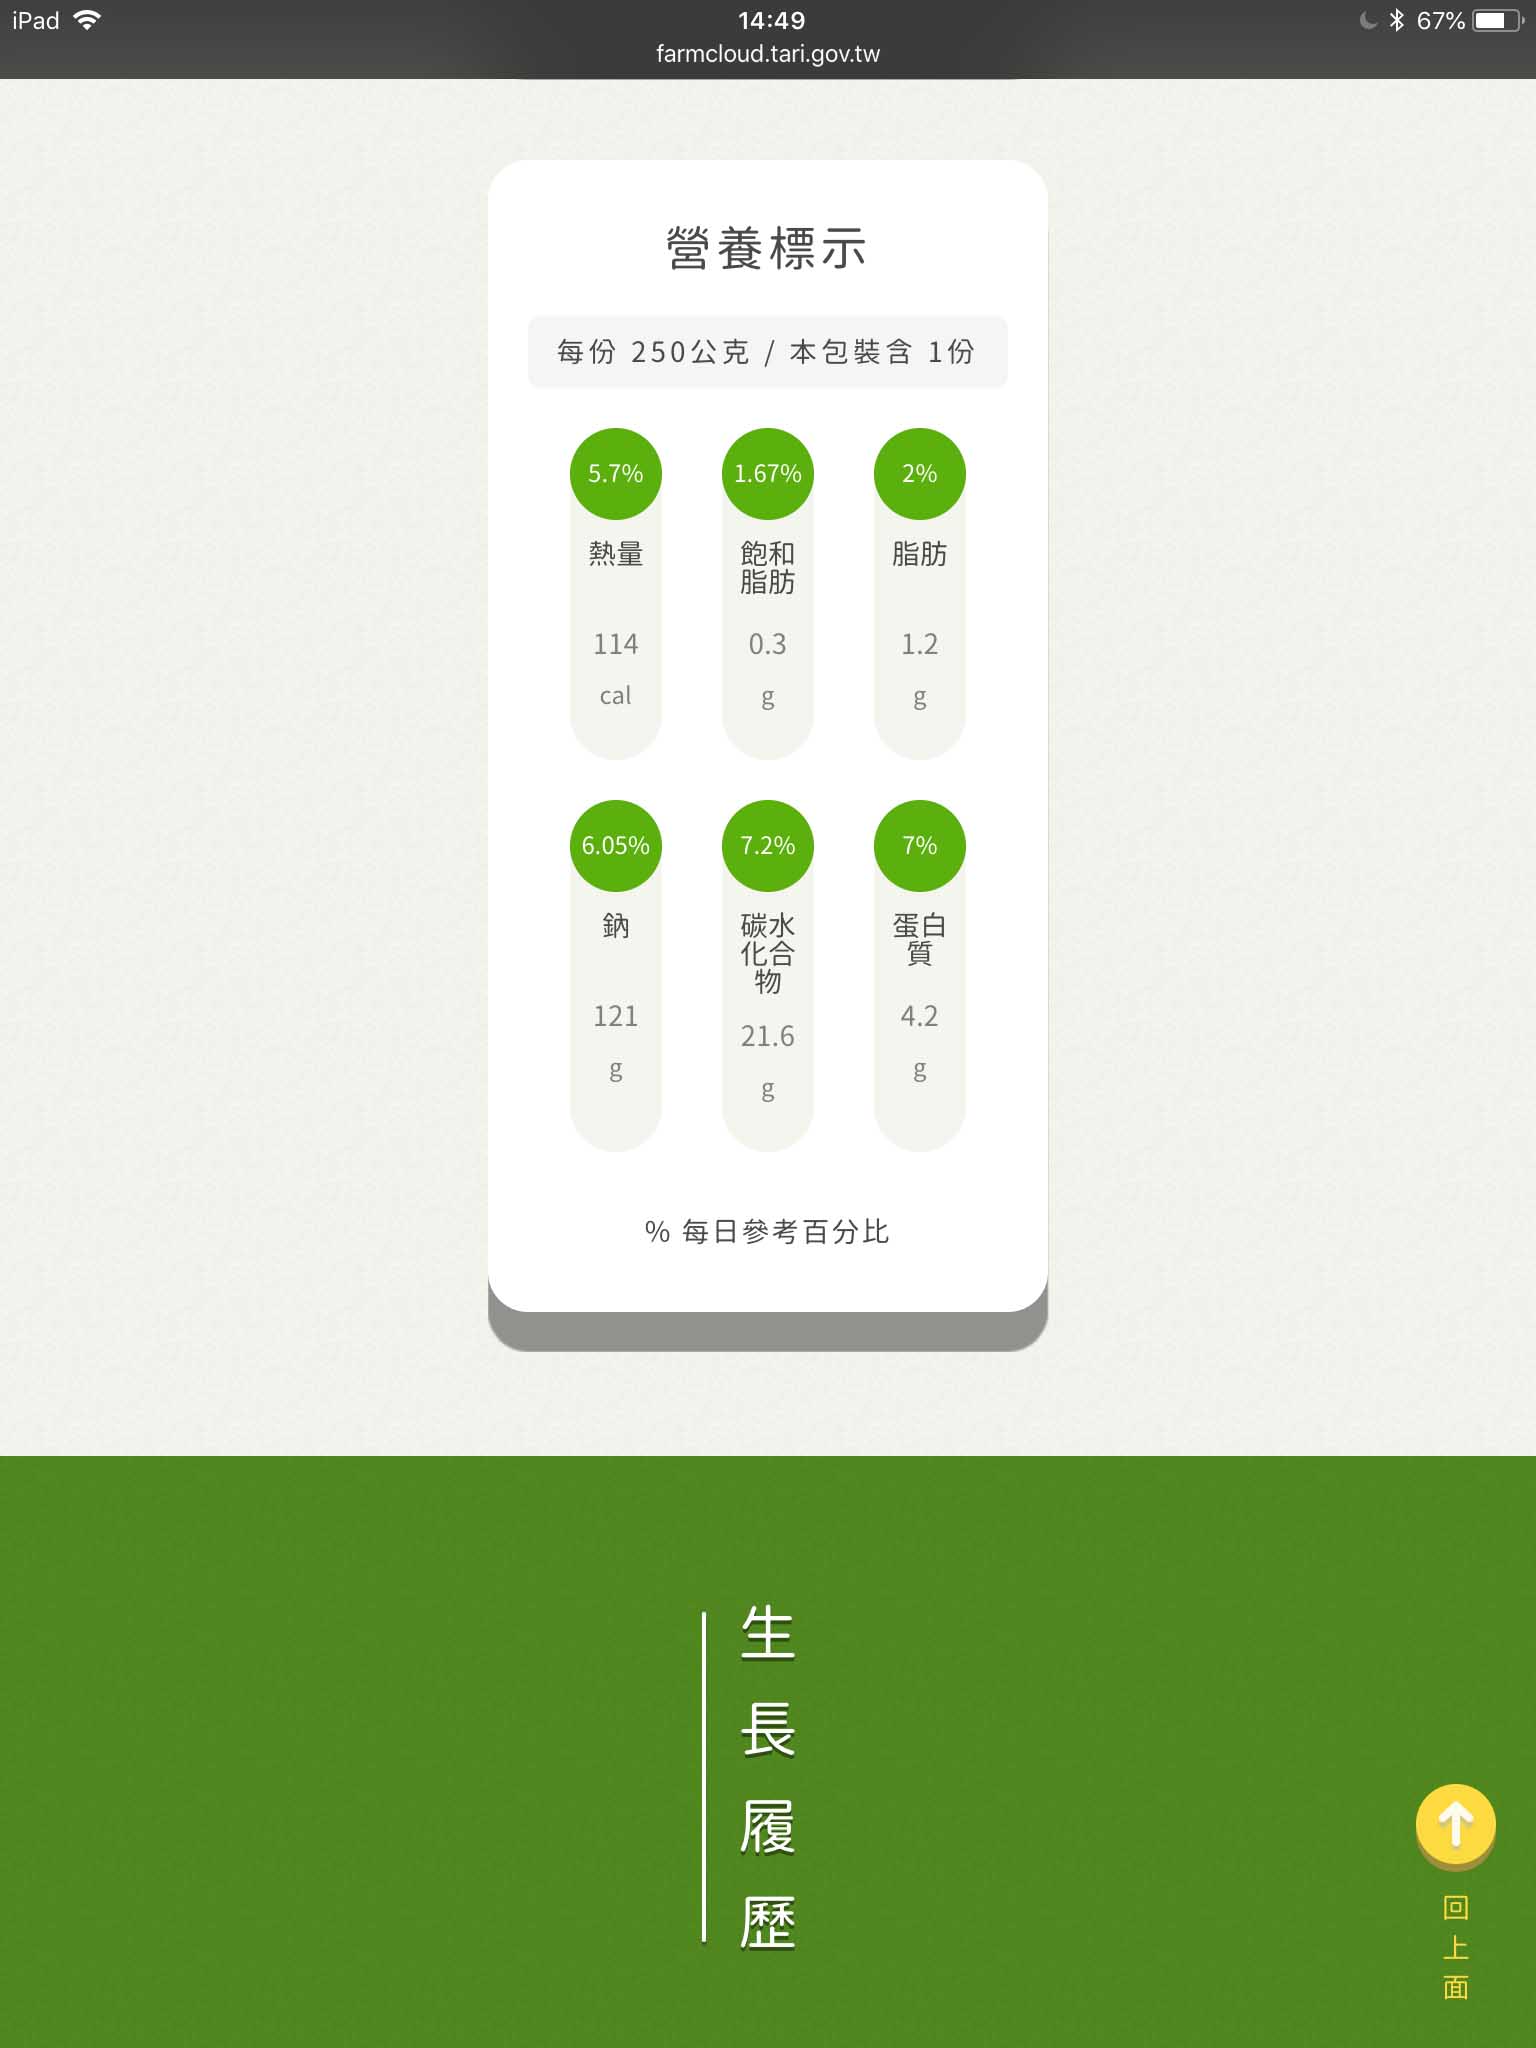
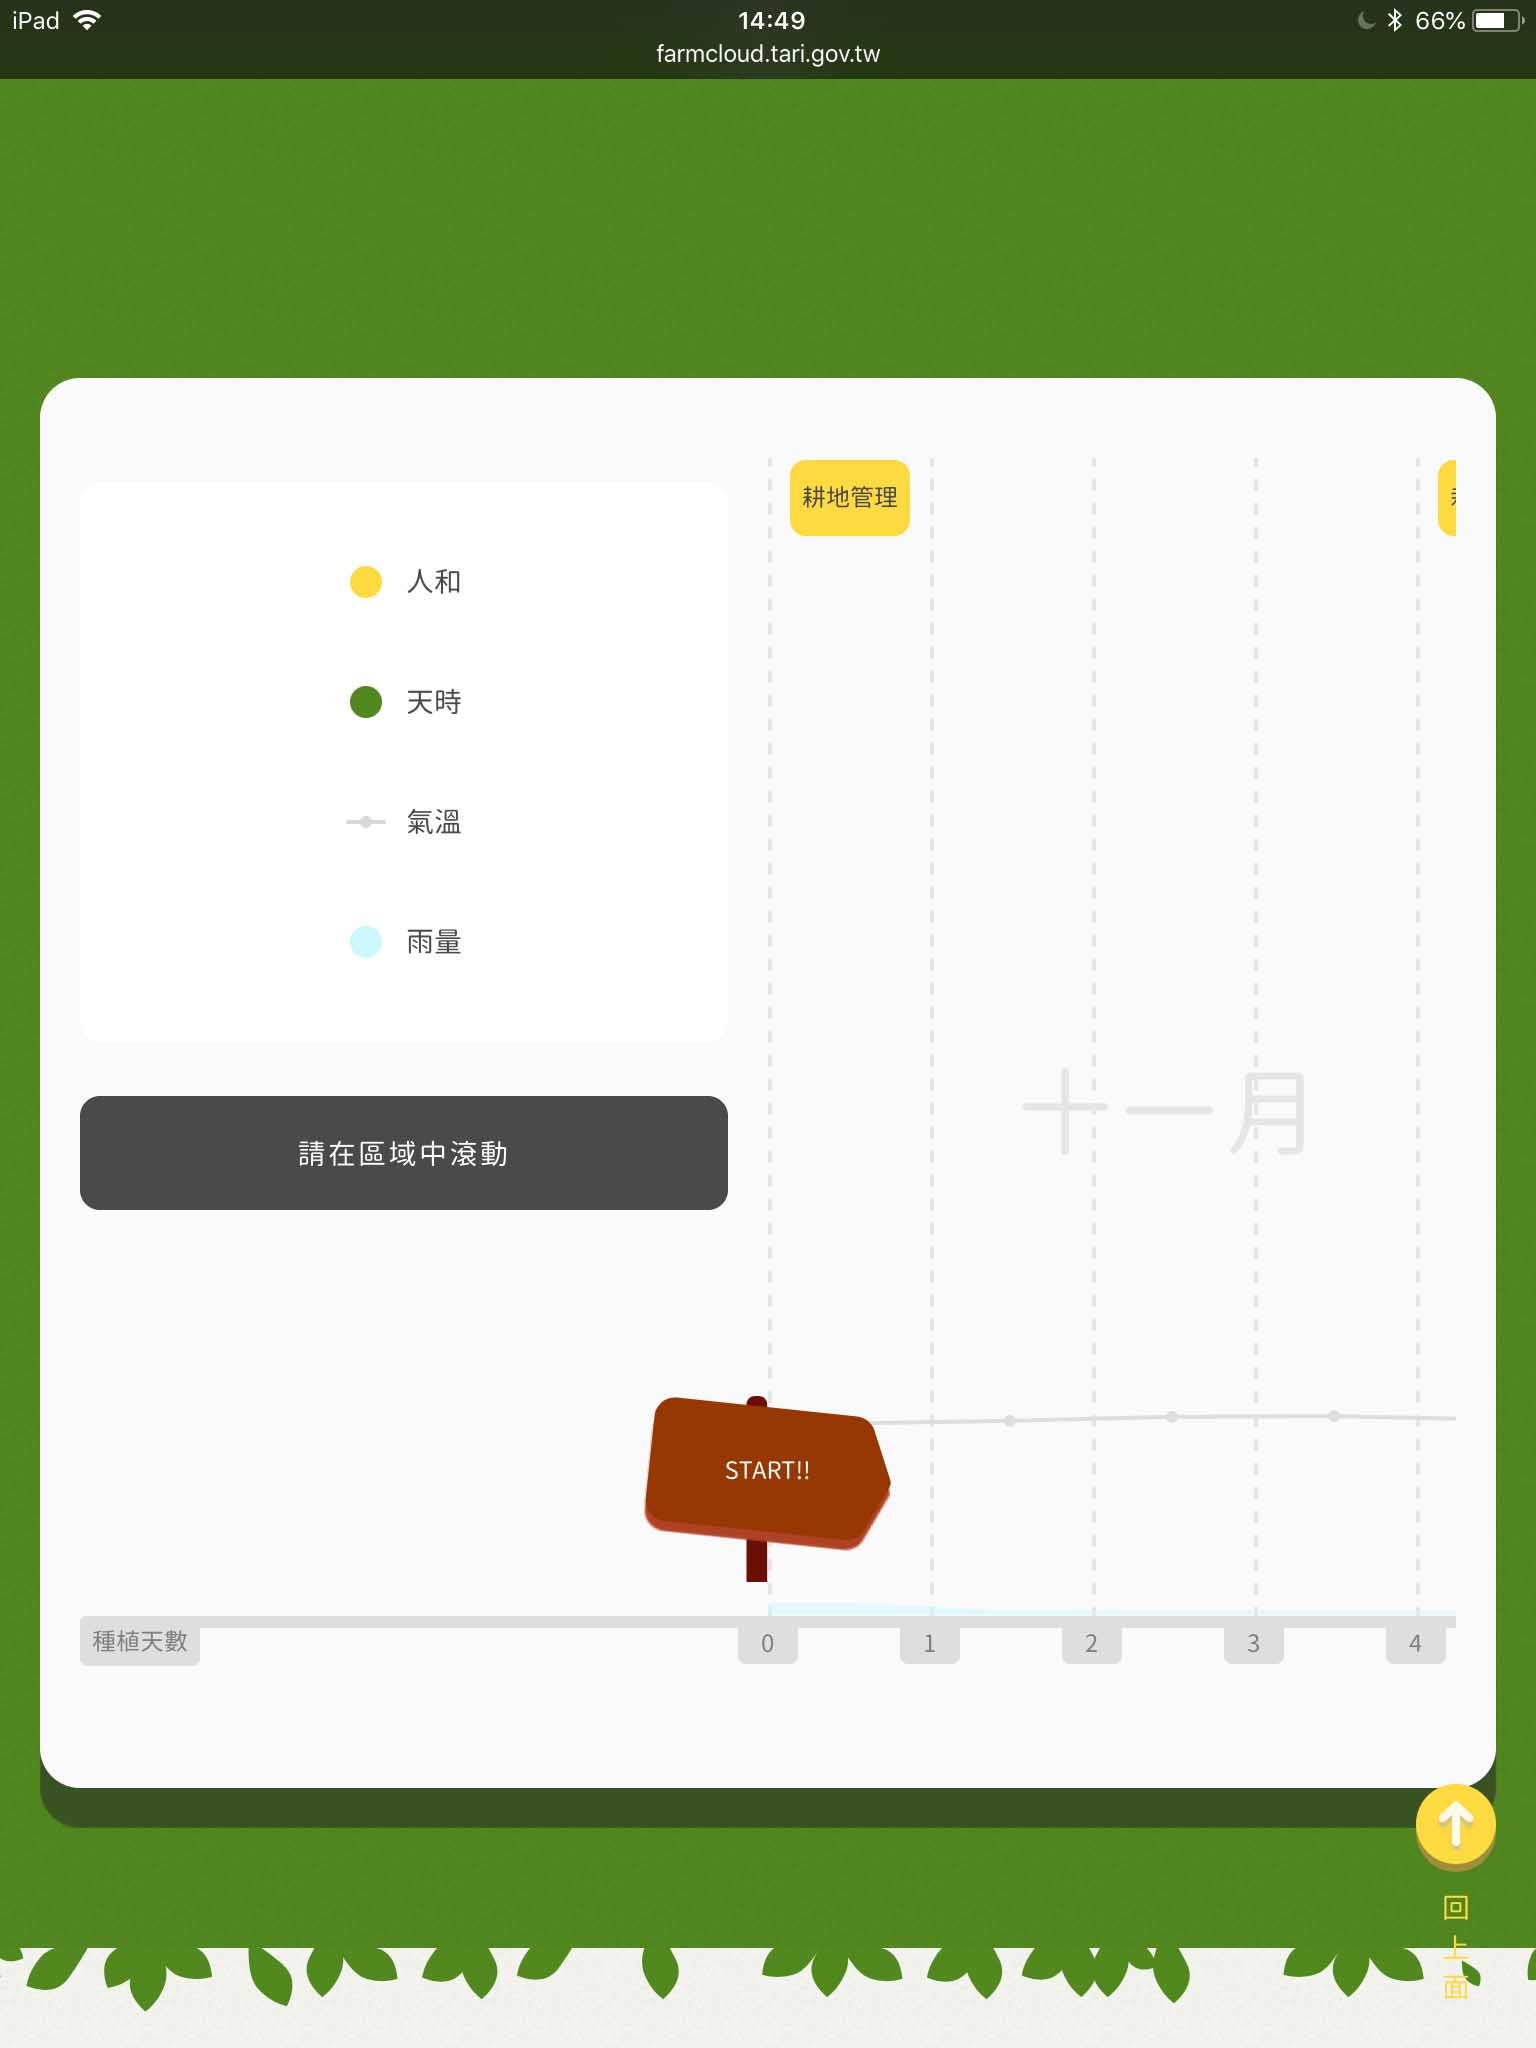
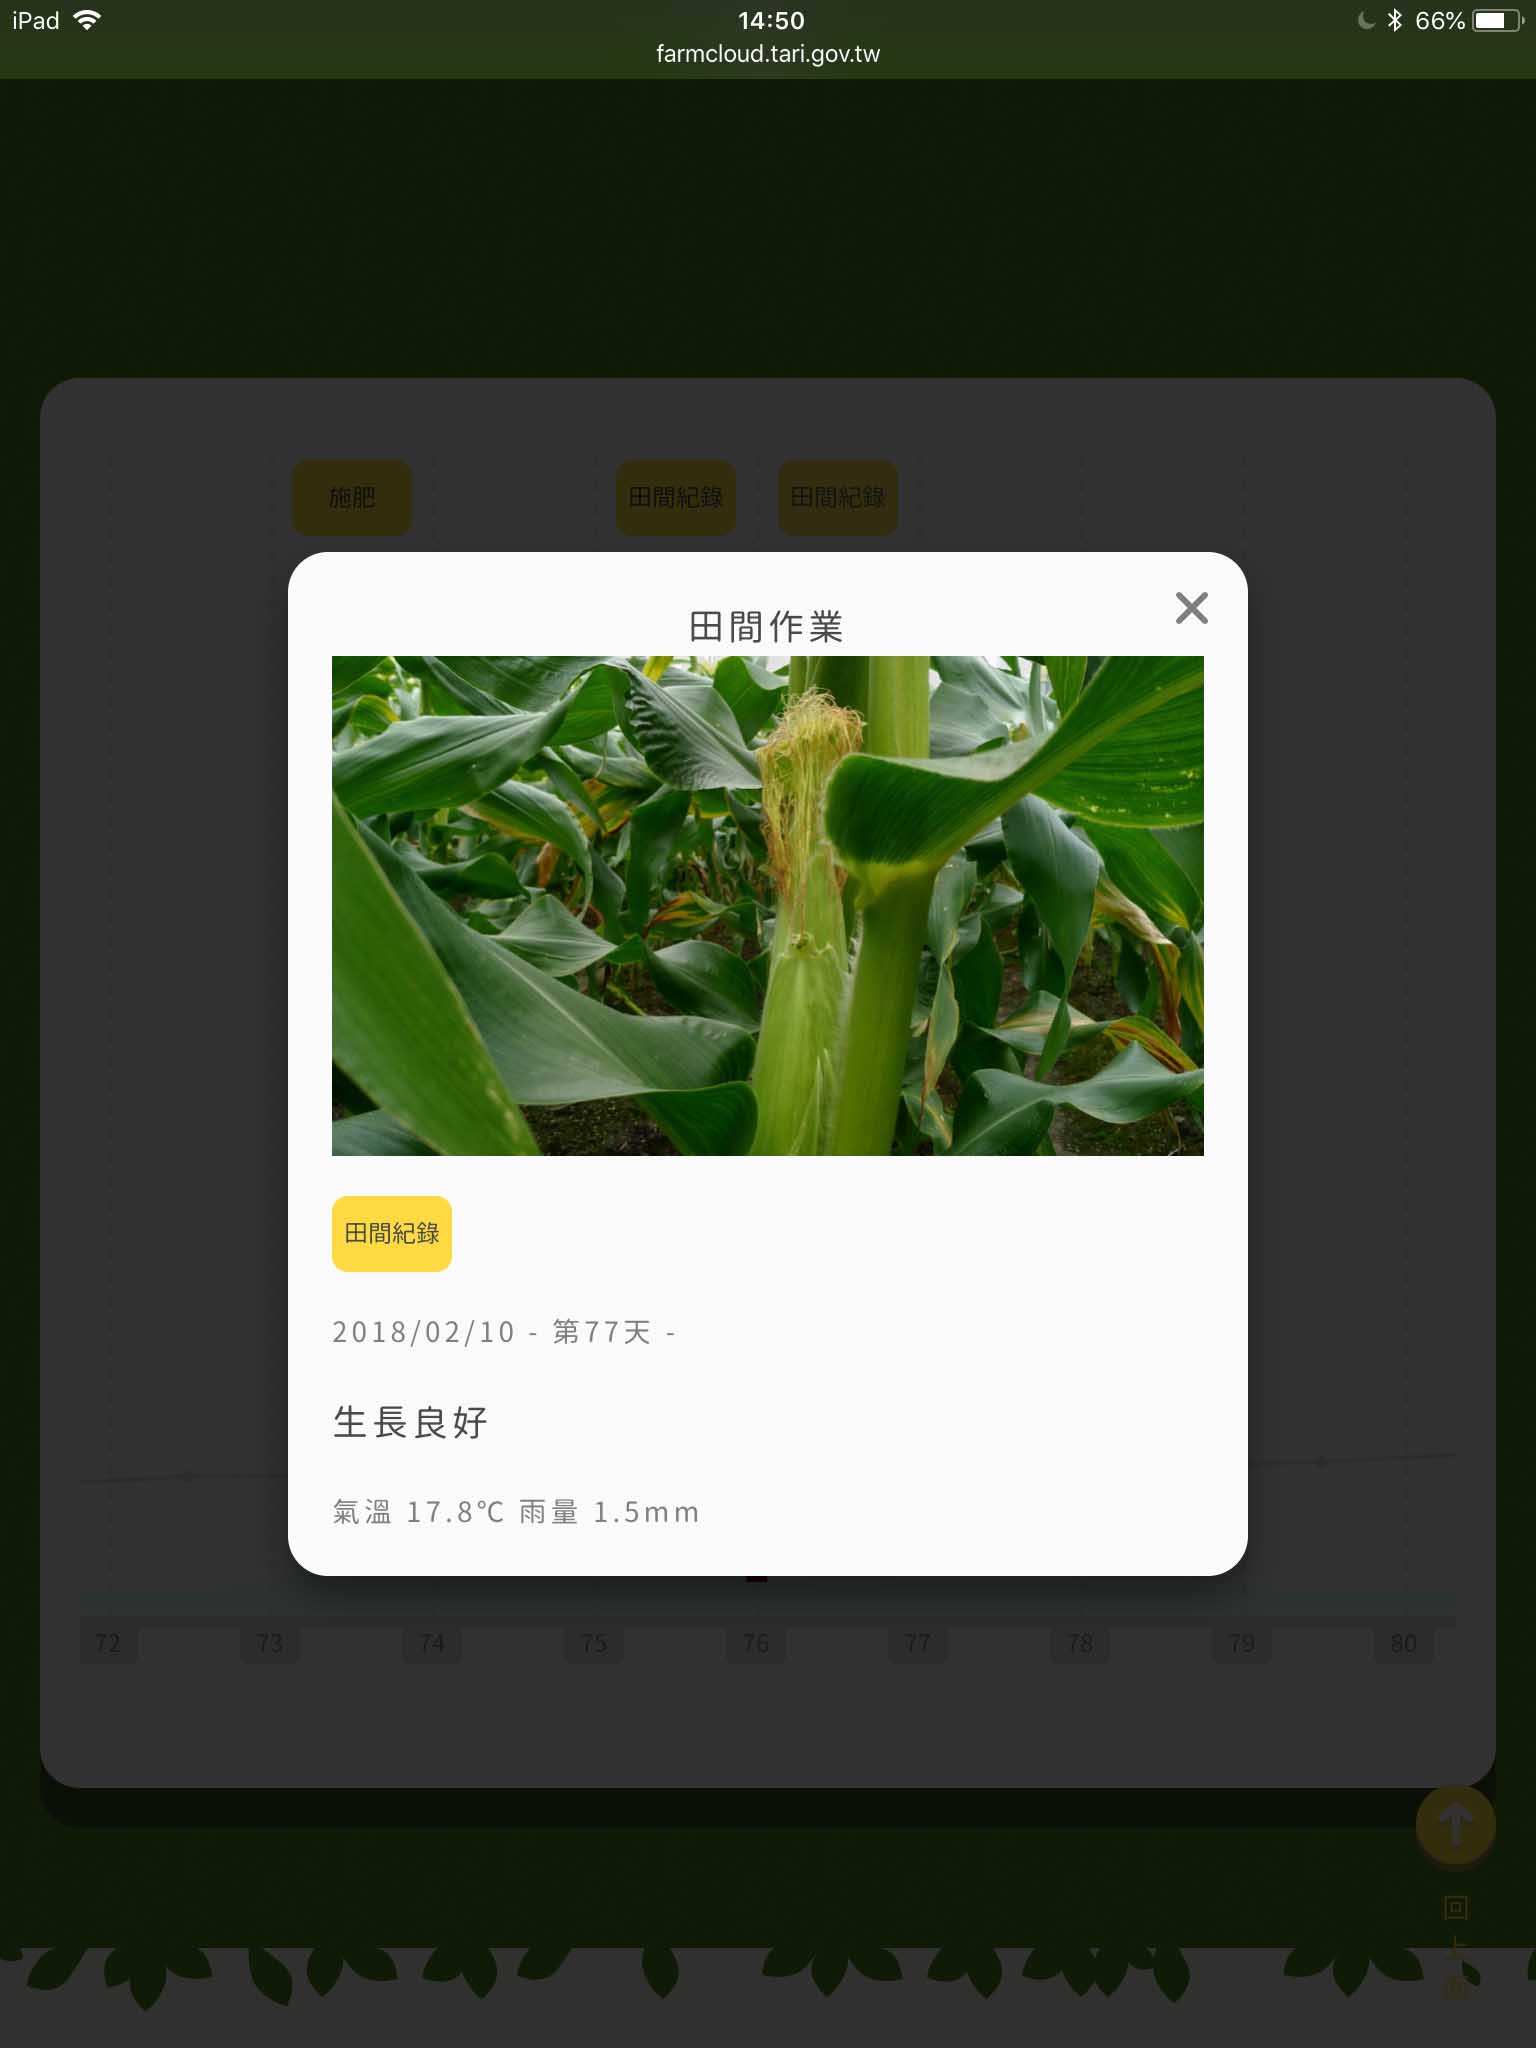
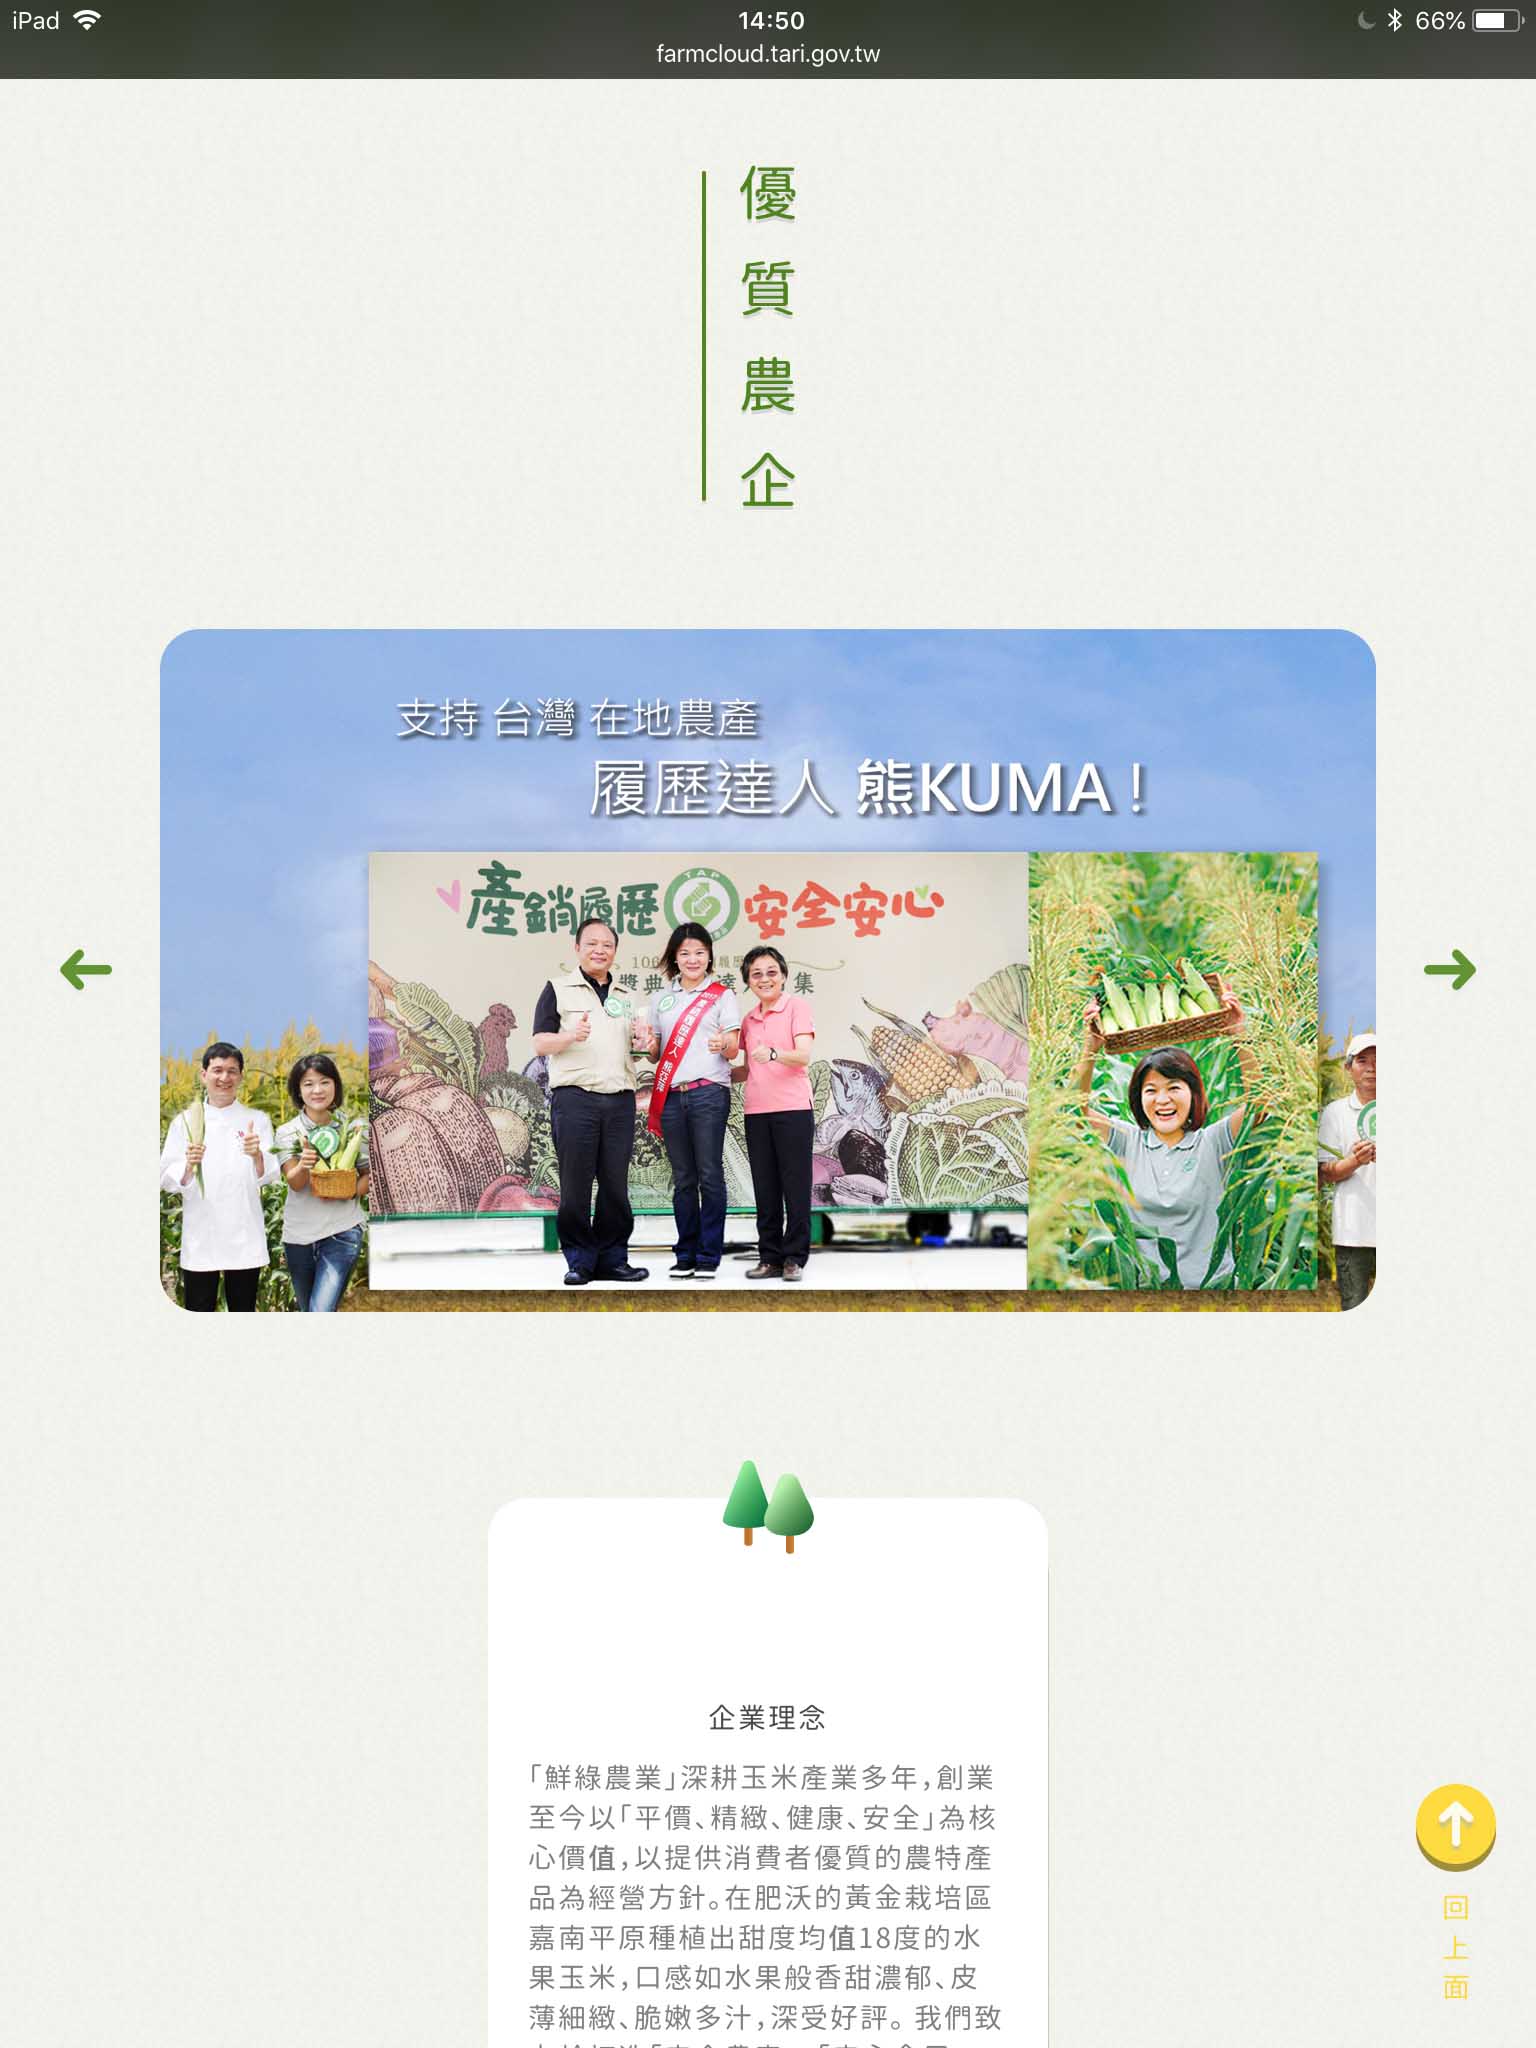
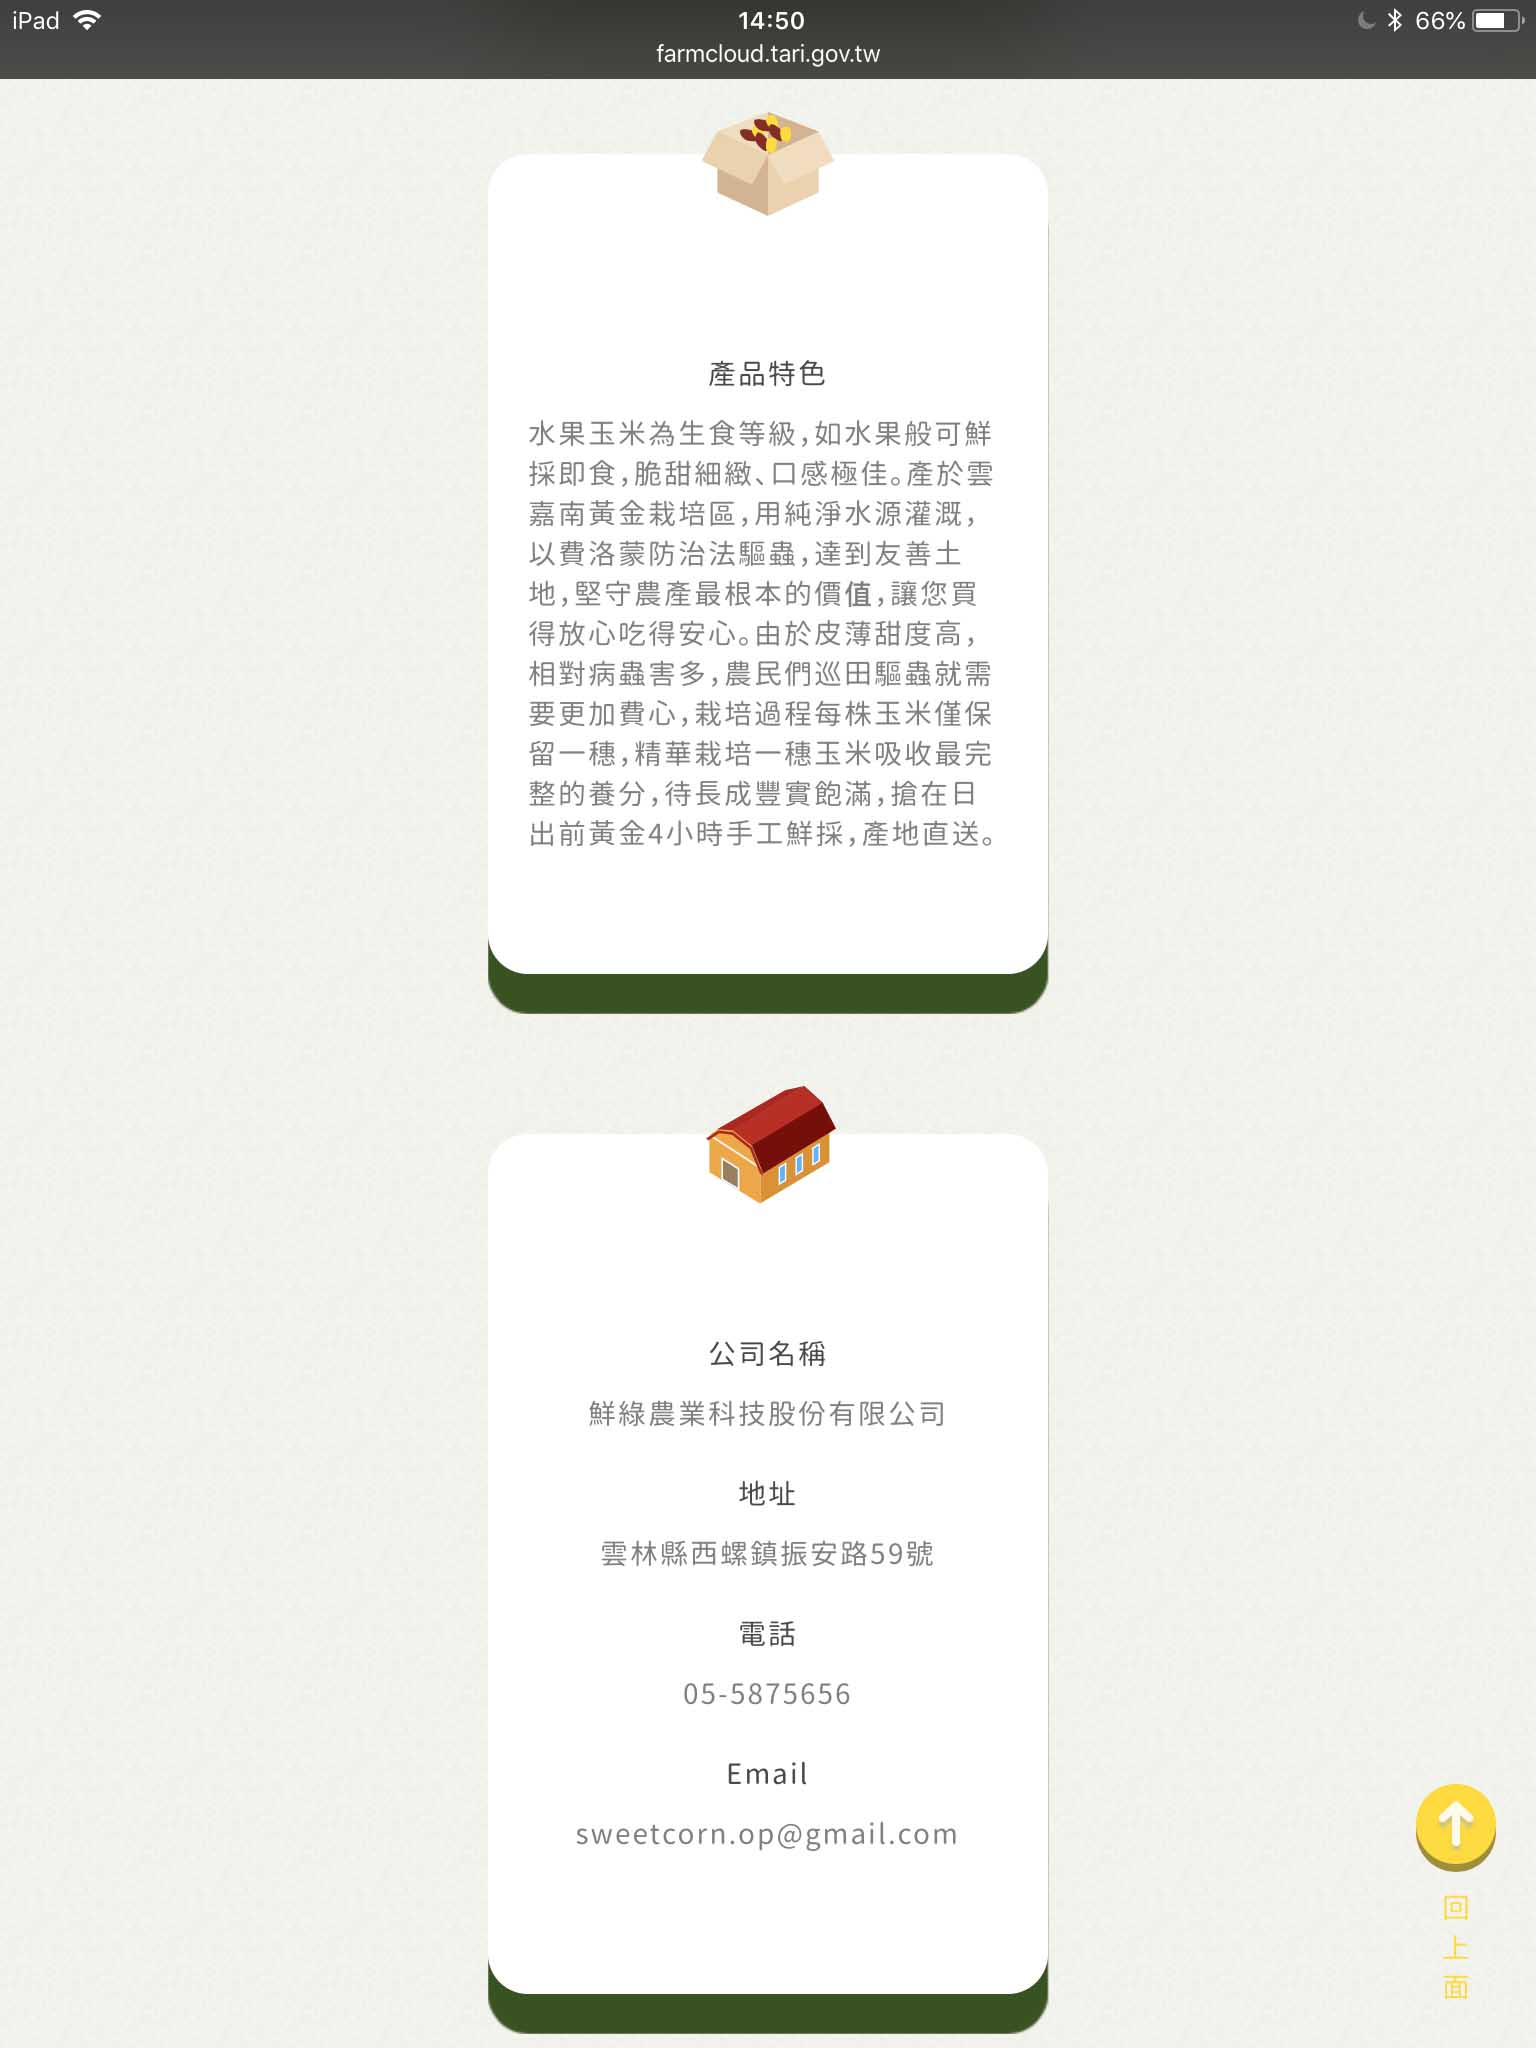
Consumers can see the whole growth process of crops by scanning into i-Plants customer platform via mobile phones. The platform not only provides the recoding of photos during the process from seedlings to harvest, but also the climate and soil data.
Many of the consumers eat corns but don't know where corns come from. The traceability system in i-Plants is not only a resume, but also the whole storytelling the growing process of crops at each stage with photos and dynamic data. When consumers are using i-Plants, they are learning food and farming education at the same time.

CONCLUSION
Result
i-Plants records crops growing status with the field recording APP. It also combines big agricultural data to let farmers know the right time for the application of pesticides or fertilizer and harvest. Usually, crop pests would break out when accumulate to a certain extent, and the Taiwan Agricultural Research Institute has the monitoring data every week in the last few years. Before the outbreak, i-Plants will inform the farmer. So that they can do the precaution early without conjecture by themselves. Since there is a database for reference, i-Plants can also assist novice farmers for farming.