OVERVIEW
About the Project
Use the data in Environmental Resources DataBase and consult the discipline policy in 1987-2014 Taiwan Environmental Quality Report and Environment White Paper from 2003 to 2015 to enhance public awareness of the environmental control act and understand the trends of environmental monitoring data. Throughout vectorization and digitization spatial data and series data in combination with the related policy, the user can realize the meaning of environment policy. In the light of data journalism, We chose the topics which can raise the awareness of the public issue as well as optimization user interface and experience.
-
Role:
UI/UX Designer, Project Manager -
Tools:
Sketch, InVision, HTML, CSS, Highchart and Highmap(JavaScript library) -
Client:
EPA -
Timeline:
January 2016-April 2016
GOAL
The Challenge
Based on publications such as the "Environment White Paper" and "Taiwan Environmental Quality Report" published by the Environmental Protection Administration (EPA), process the trajectory of environmental protection activities such as environmental policy and strategies in combination with environmental monitoring data into visualization such as infographic and geographic information system (GIS). The project provides the application of the map integration platform for the implementation of the EPA so that the public can better realize the environmental control act and resources management.
RESEARCH
The Solution
I. Data collection and analysis
In data collection and analysis, We conduct a survey of the relevant database, project process, requirements like application programming interface (API) from each departmental data.
II. Data construction and system analysis
After investigation and analysis of the various data, We convert the results of requirement analysis into a module structure diagram to facilitate the next step.
III. System planning and design
Detailed design will be carried out to describe the internal logic processing and programming. In addition, prototyping is during this process.
IV. System development
To develop the system environment and the required features and implement system analysis.
V. Evaluation and maintenance
System evaluations are carried out to identify errors, perform maintenance, and verification.
JOURNEY MAPPING
Website Architecture
Collect information from established systems in EPA, such as Pollutant release and transfer registers (PRTRs), Environmental Water Quality Information, and Environment Resource Database (ERDB).
IDEATION
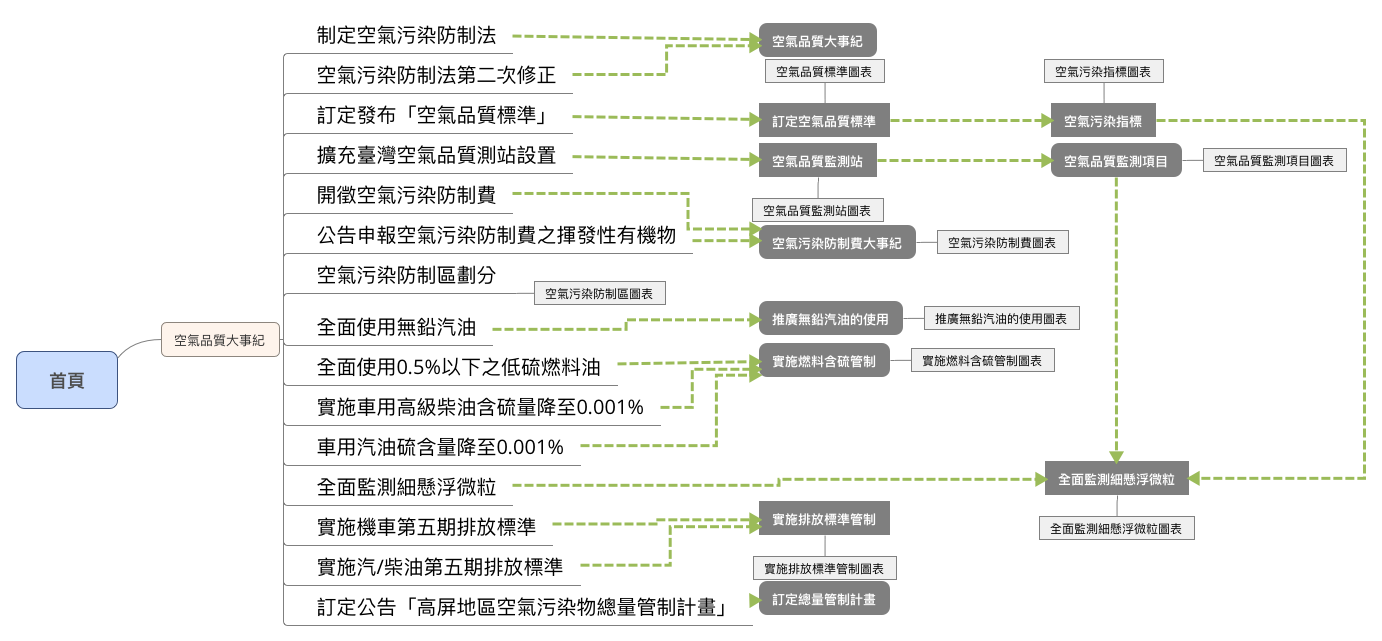
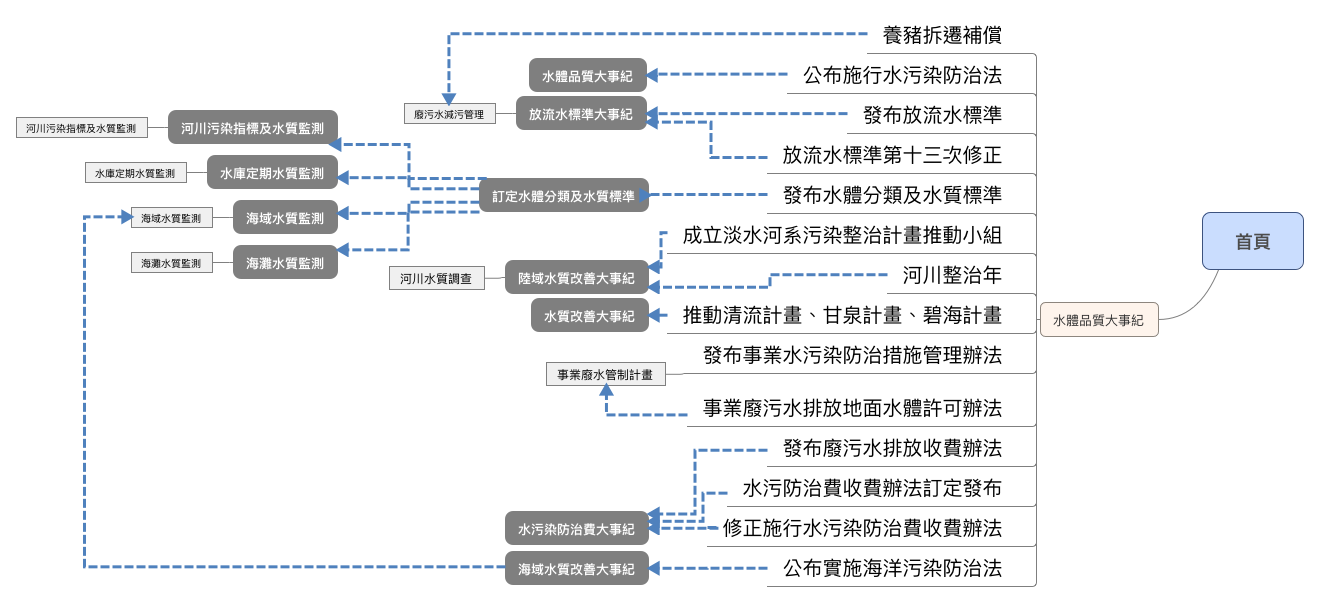
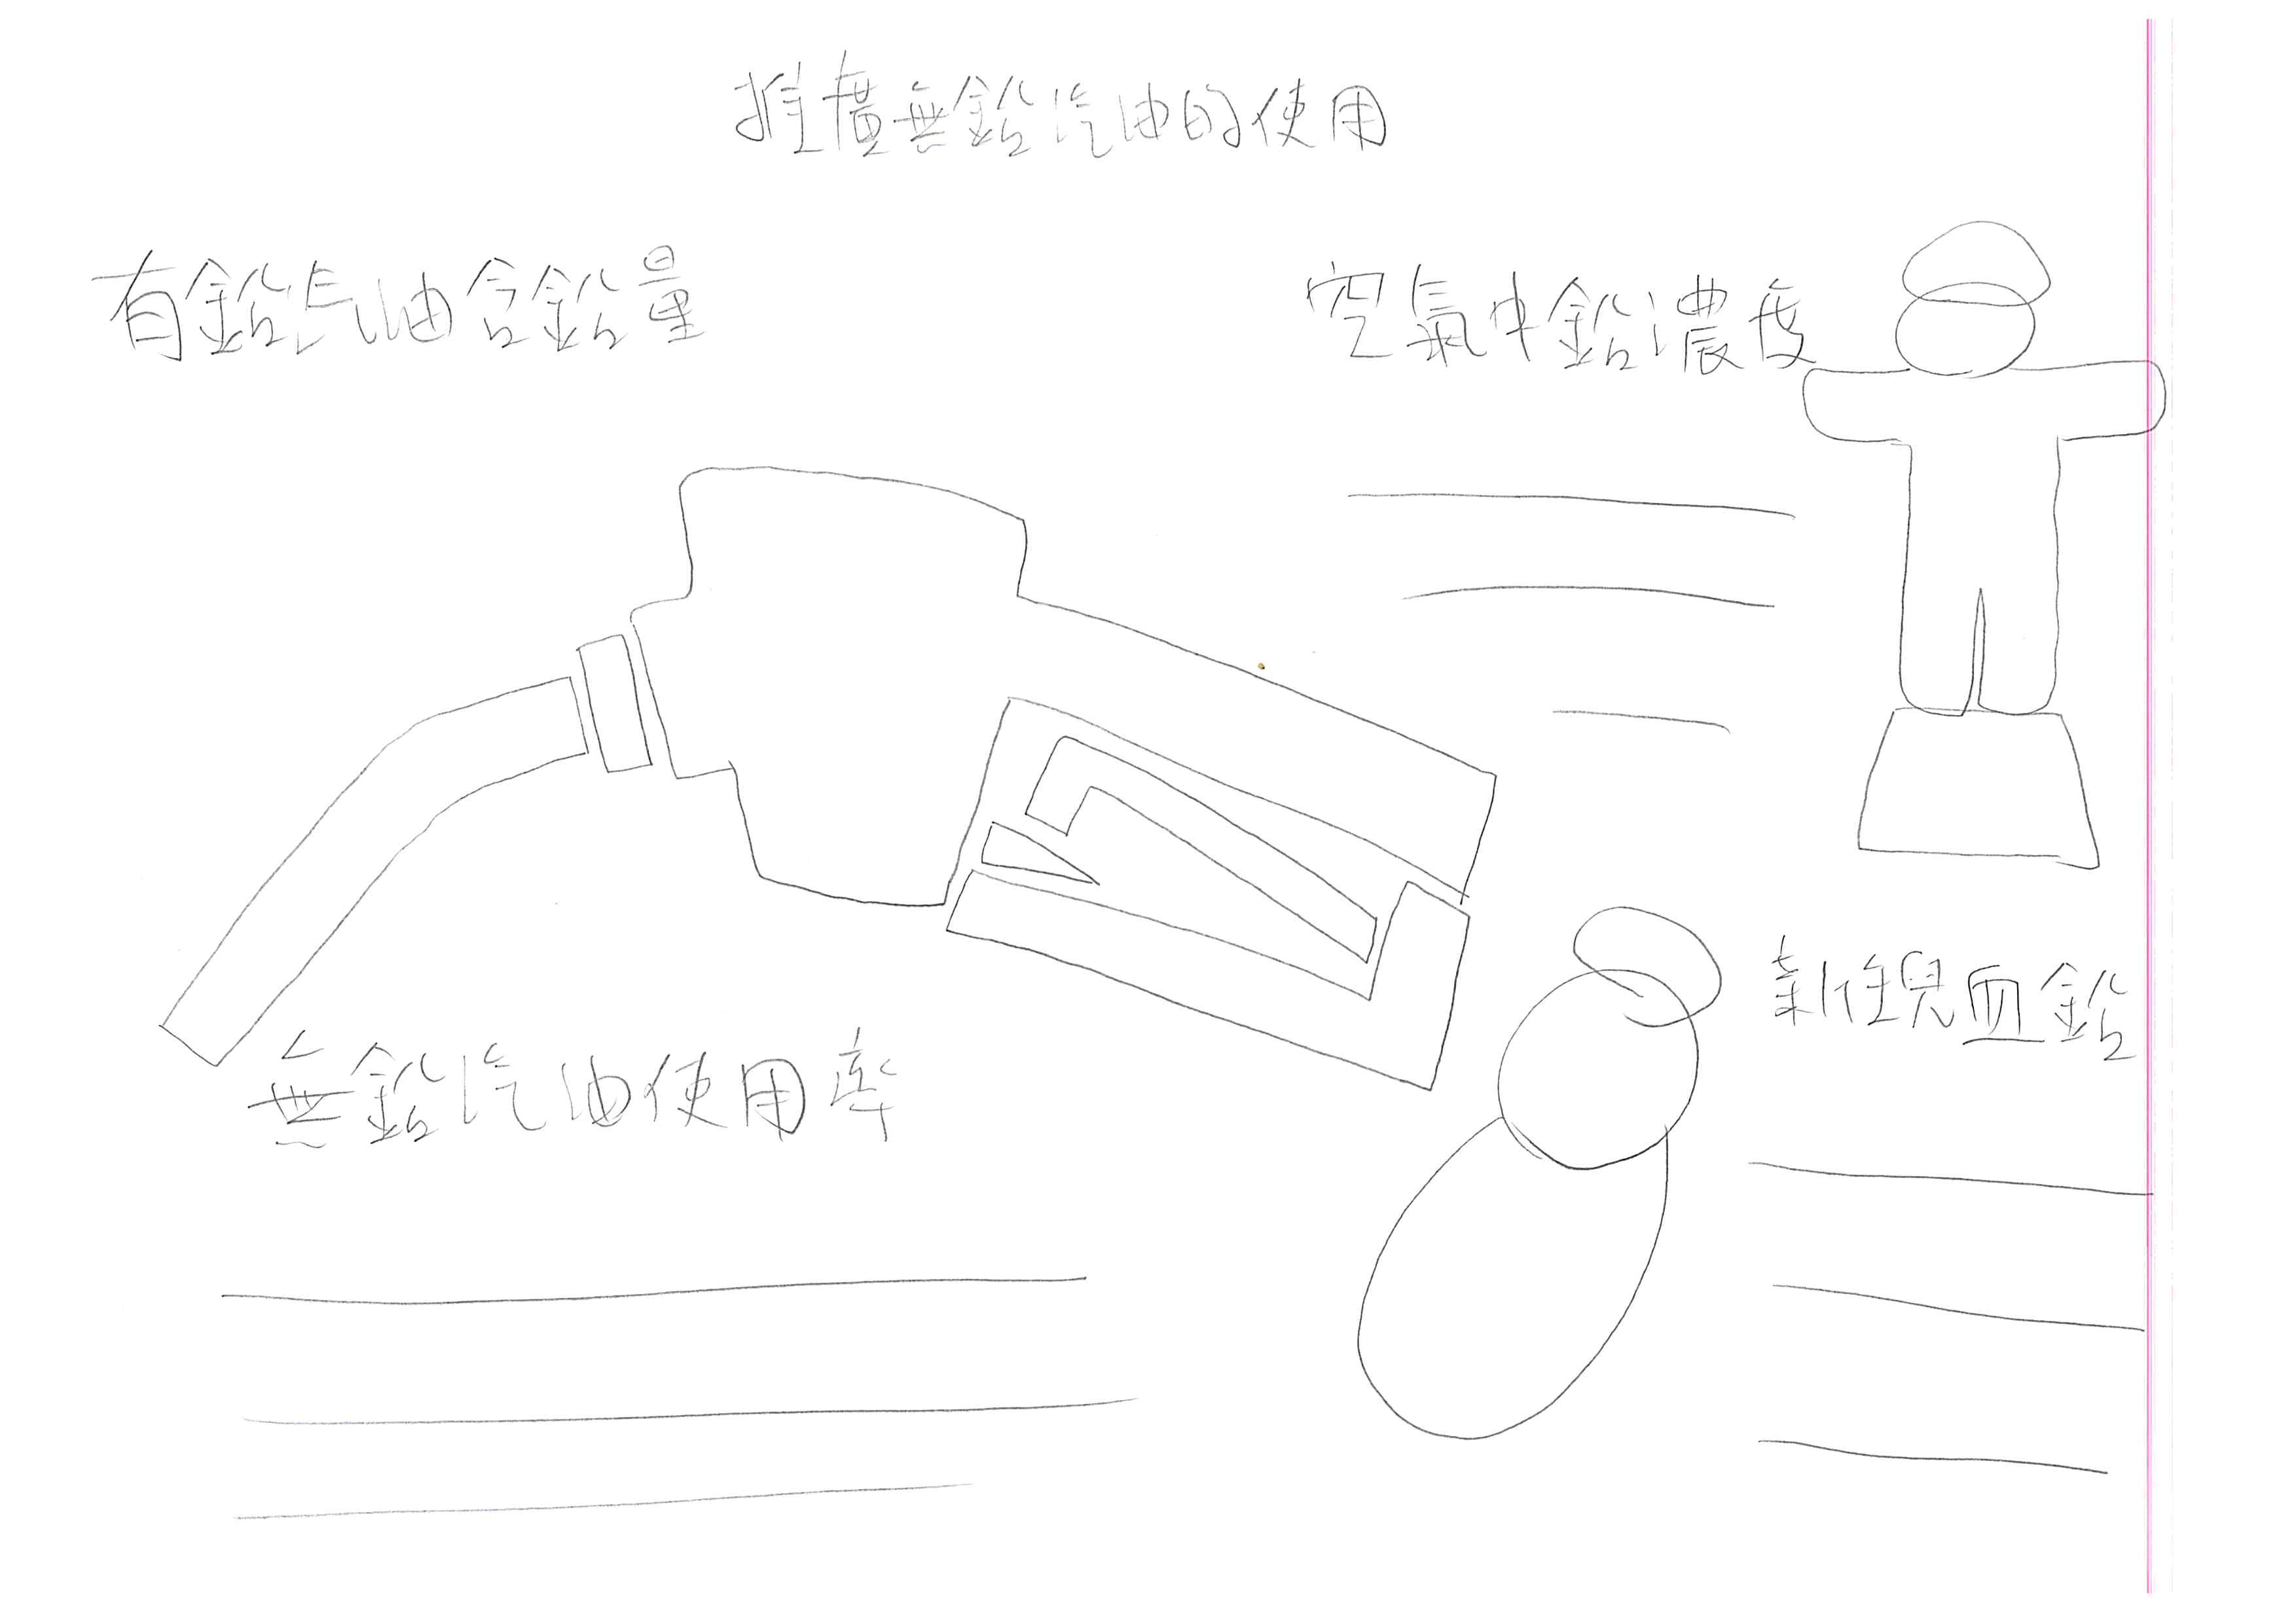
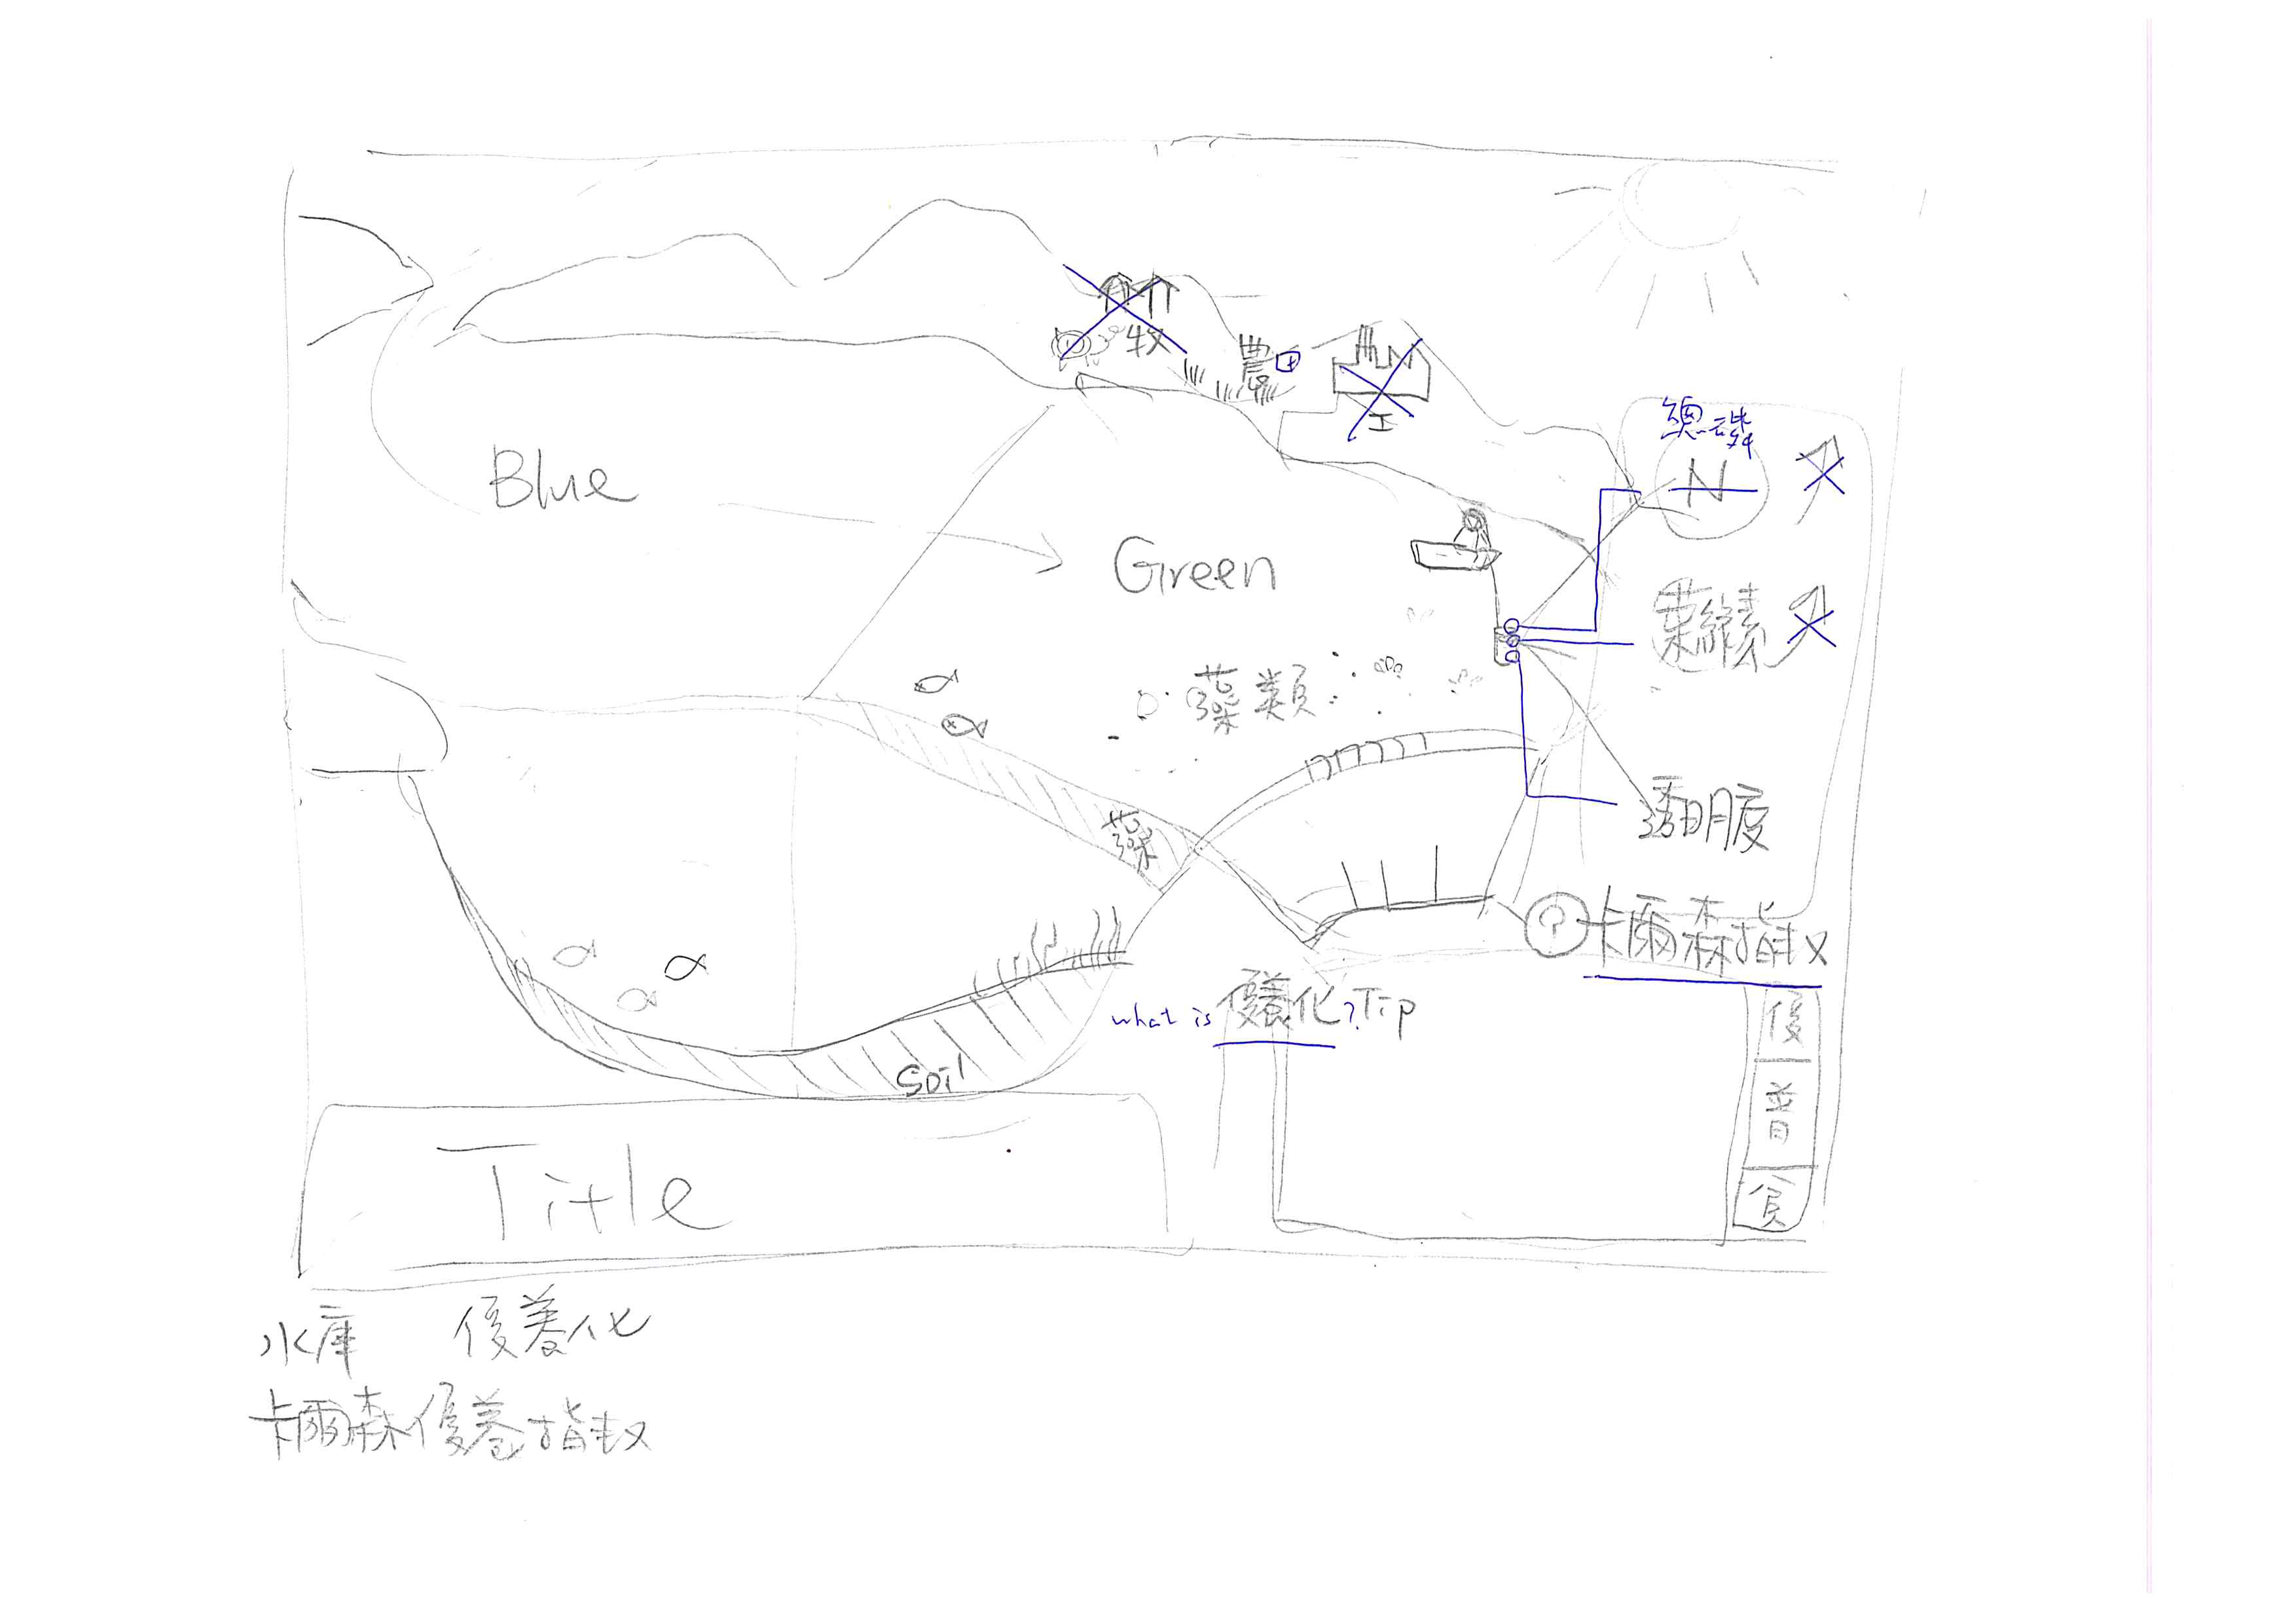
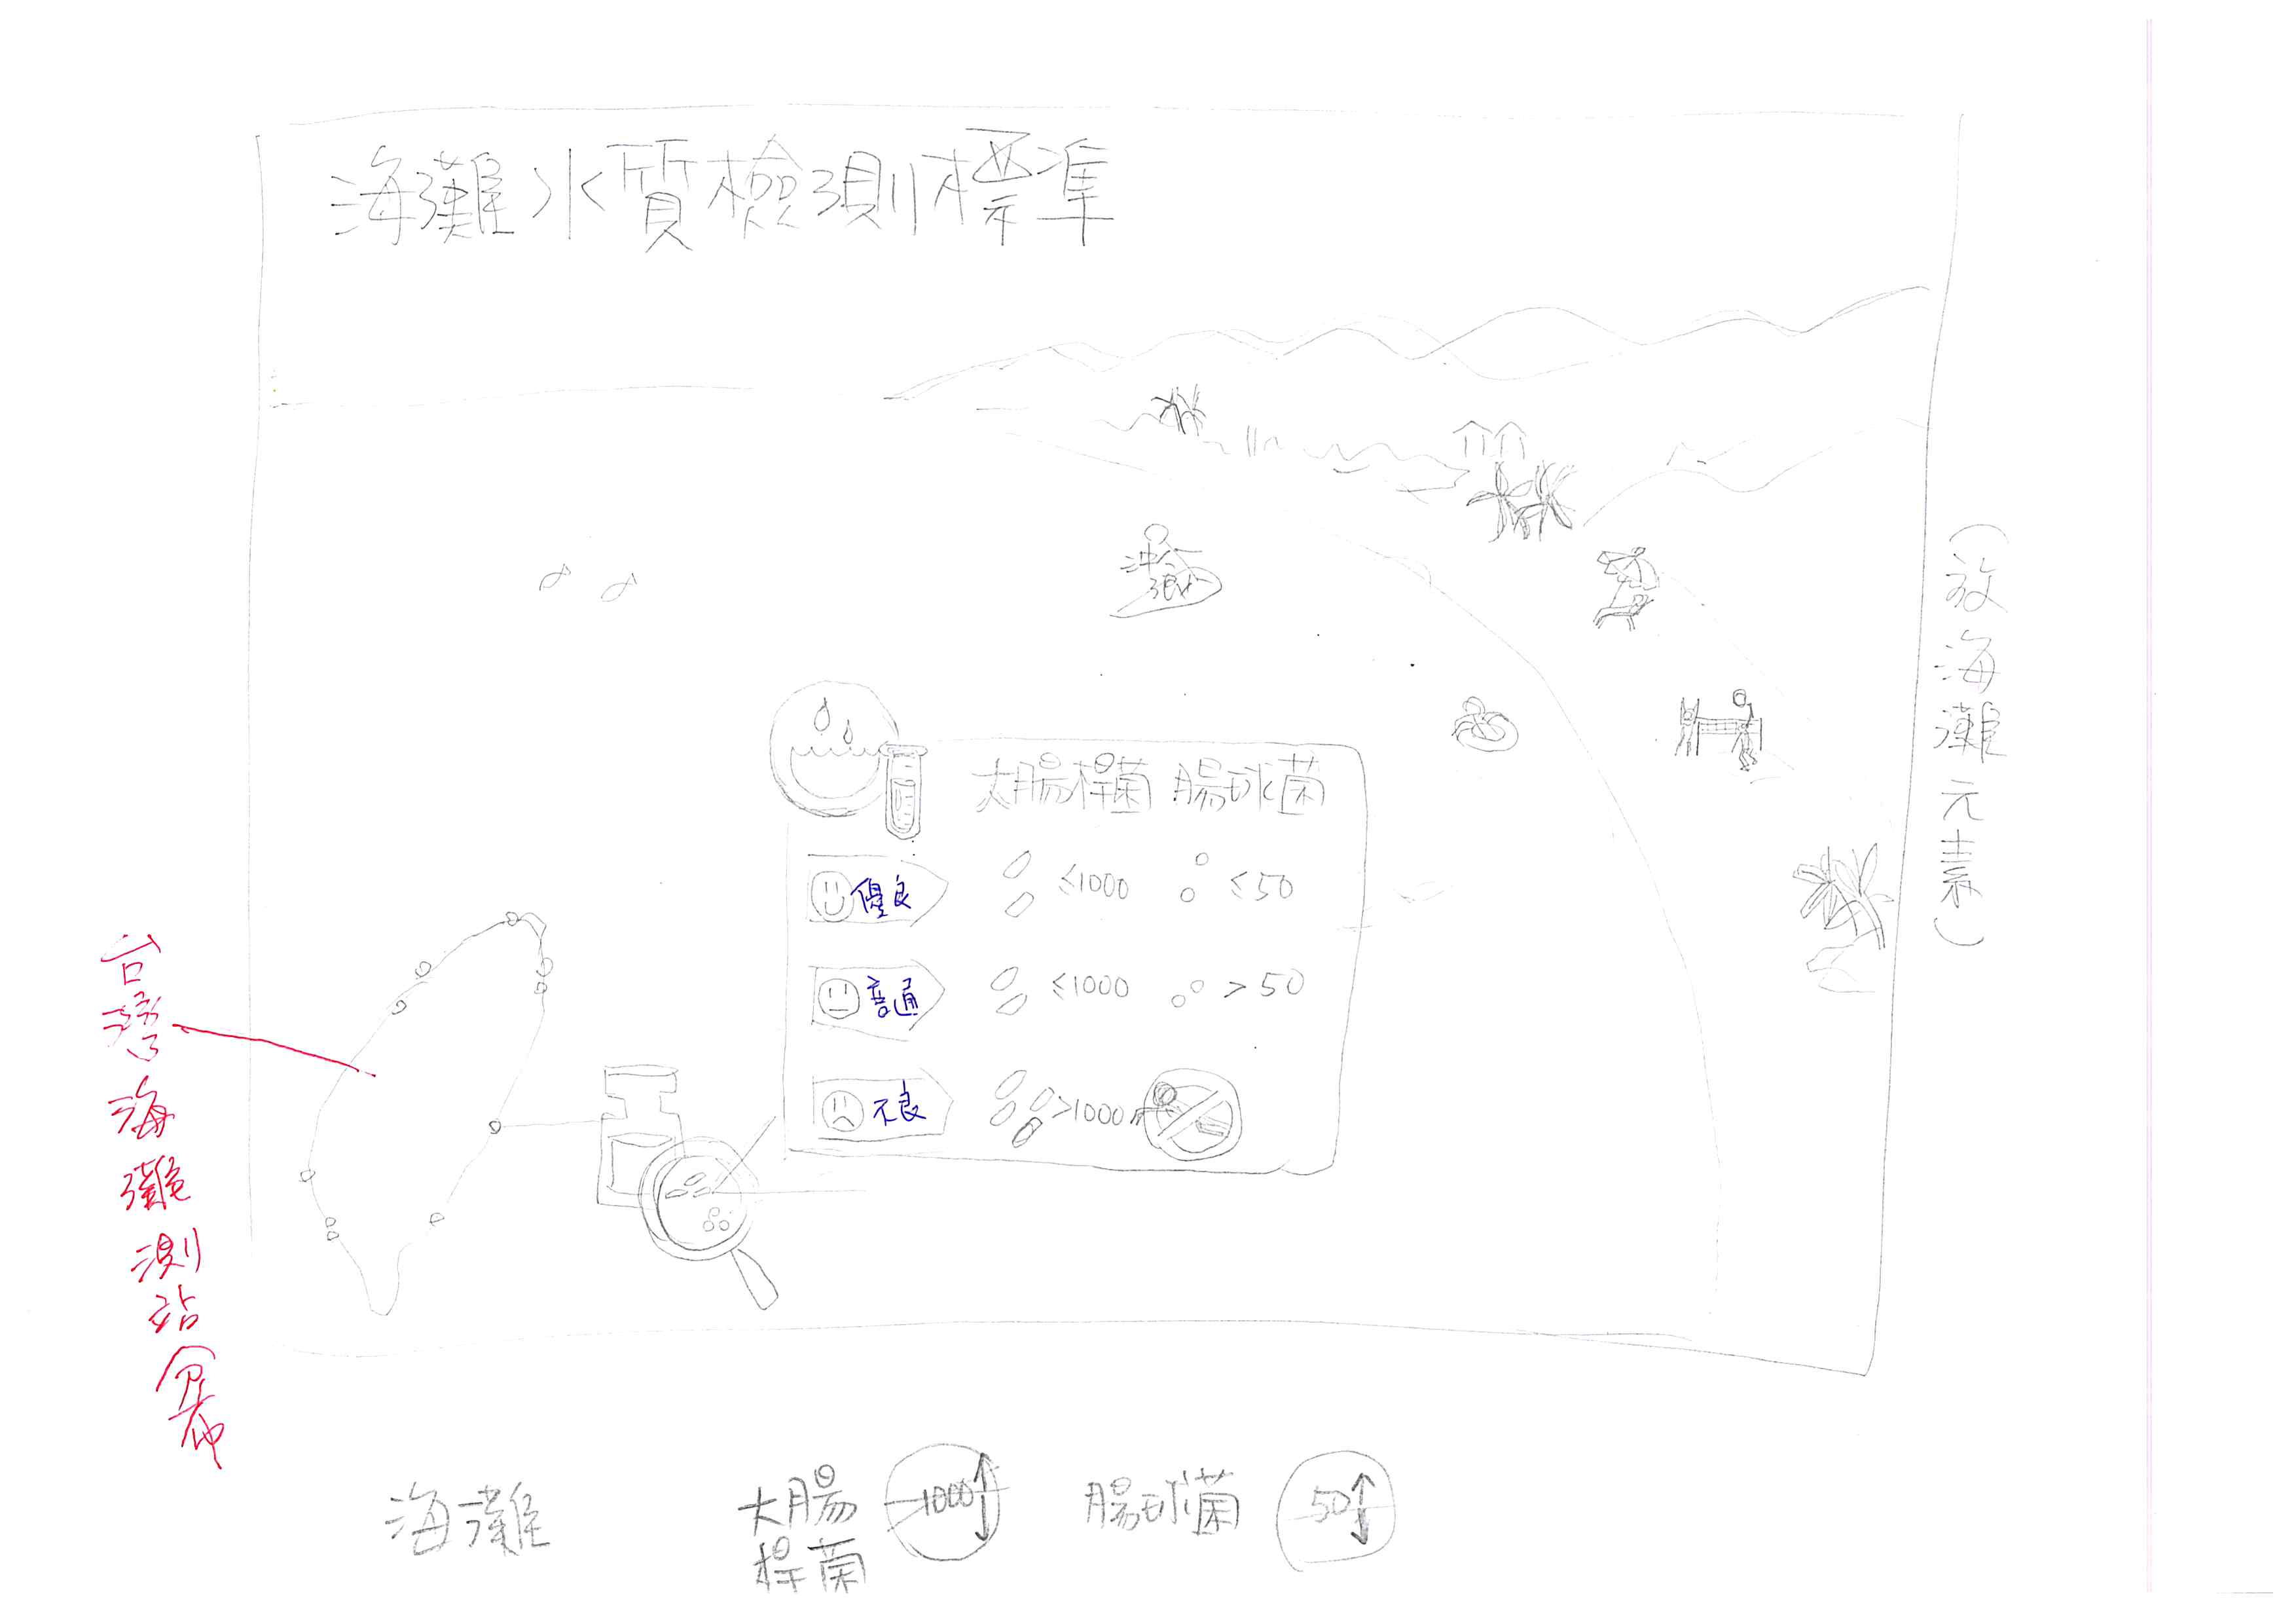
Concept Sketch
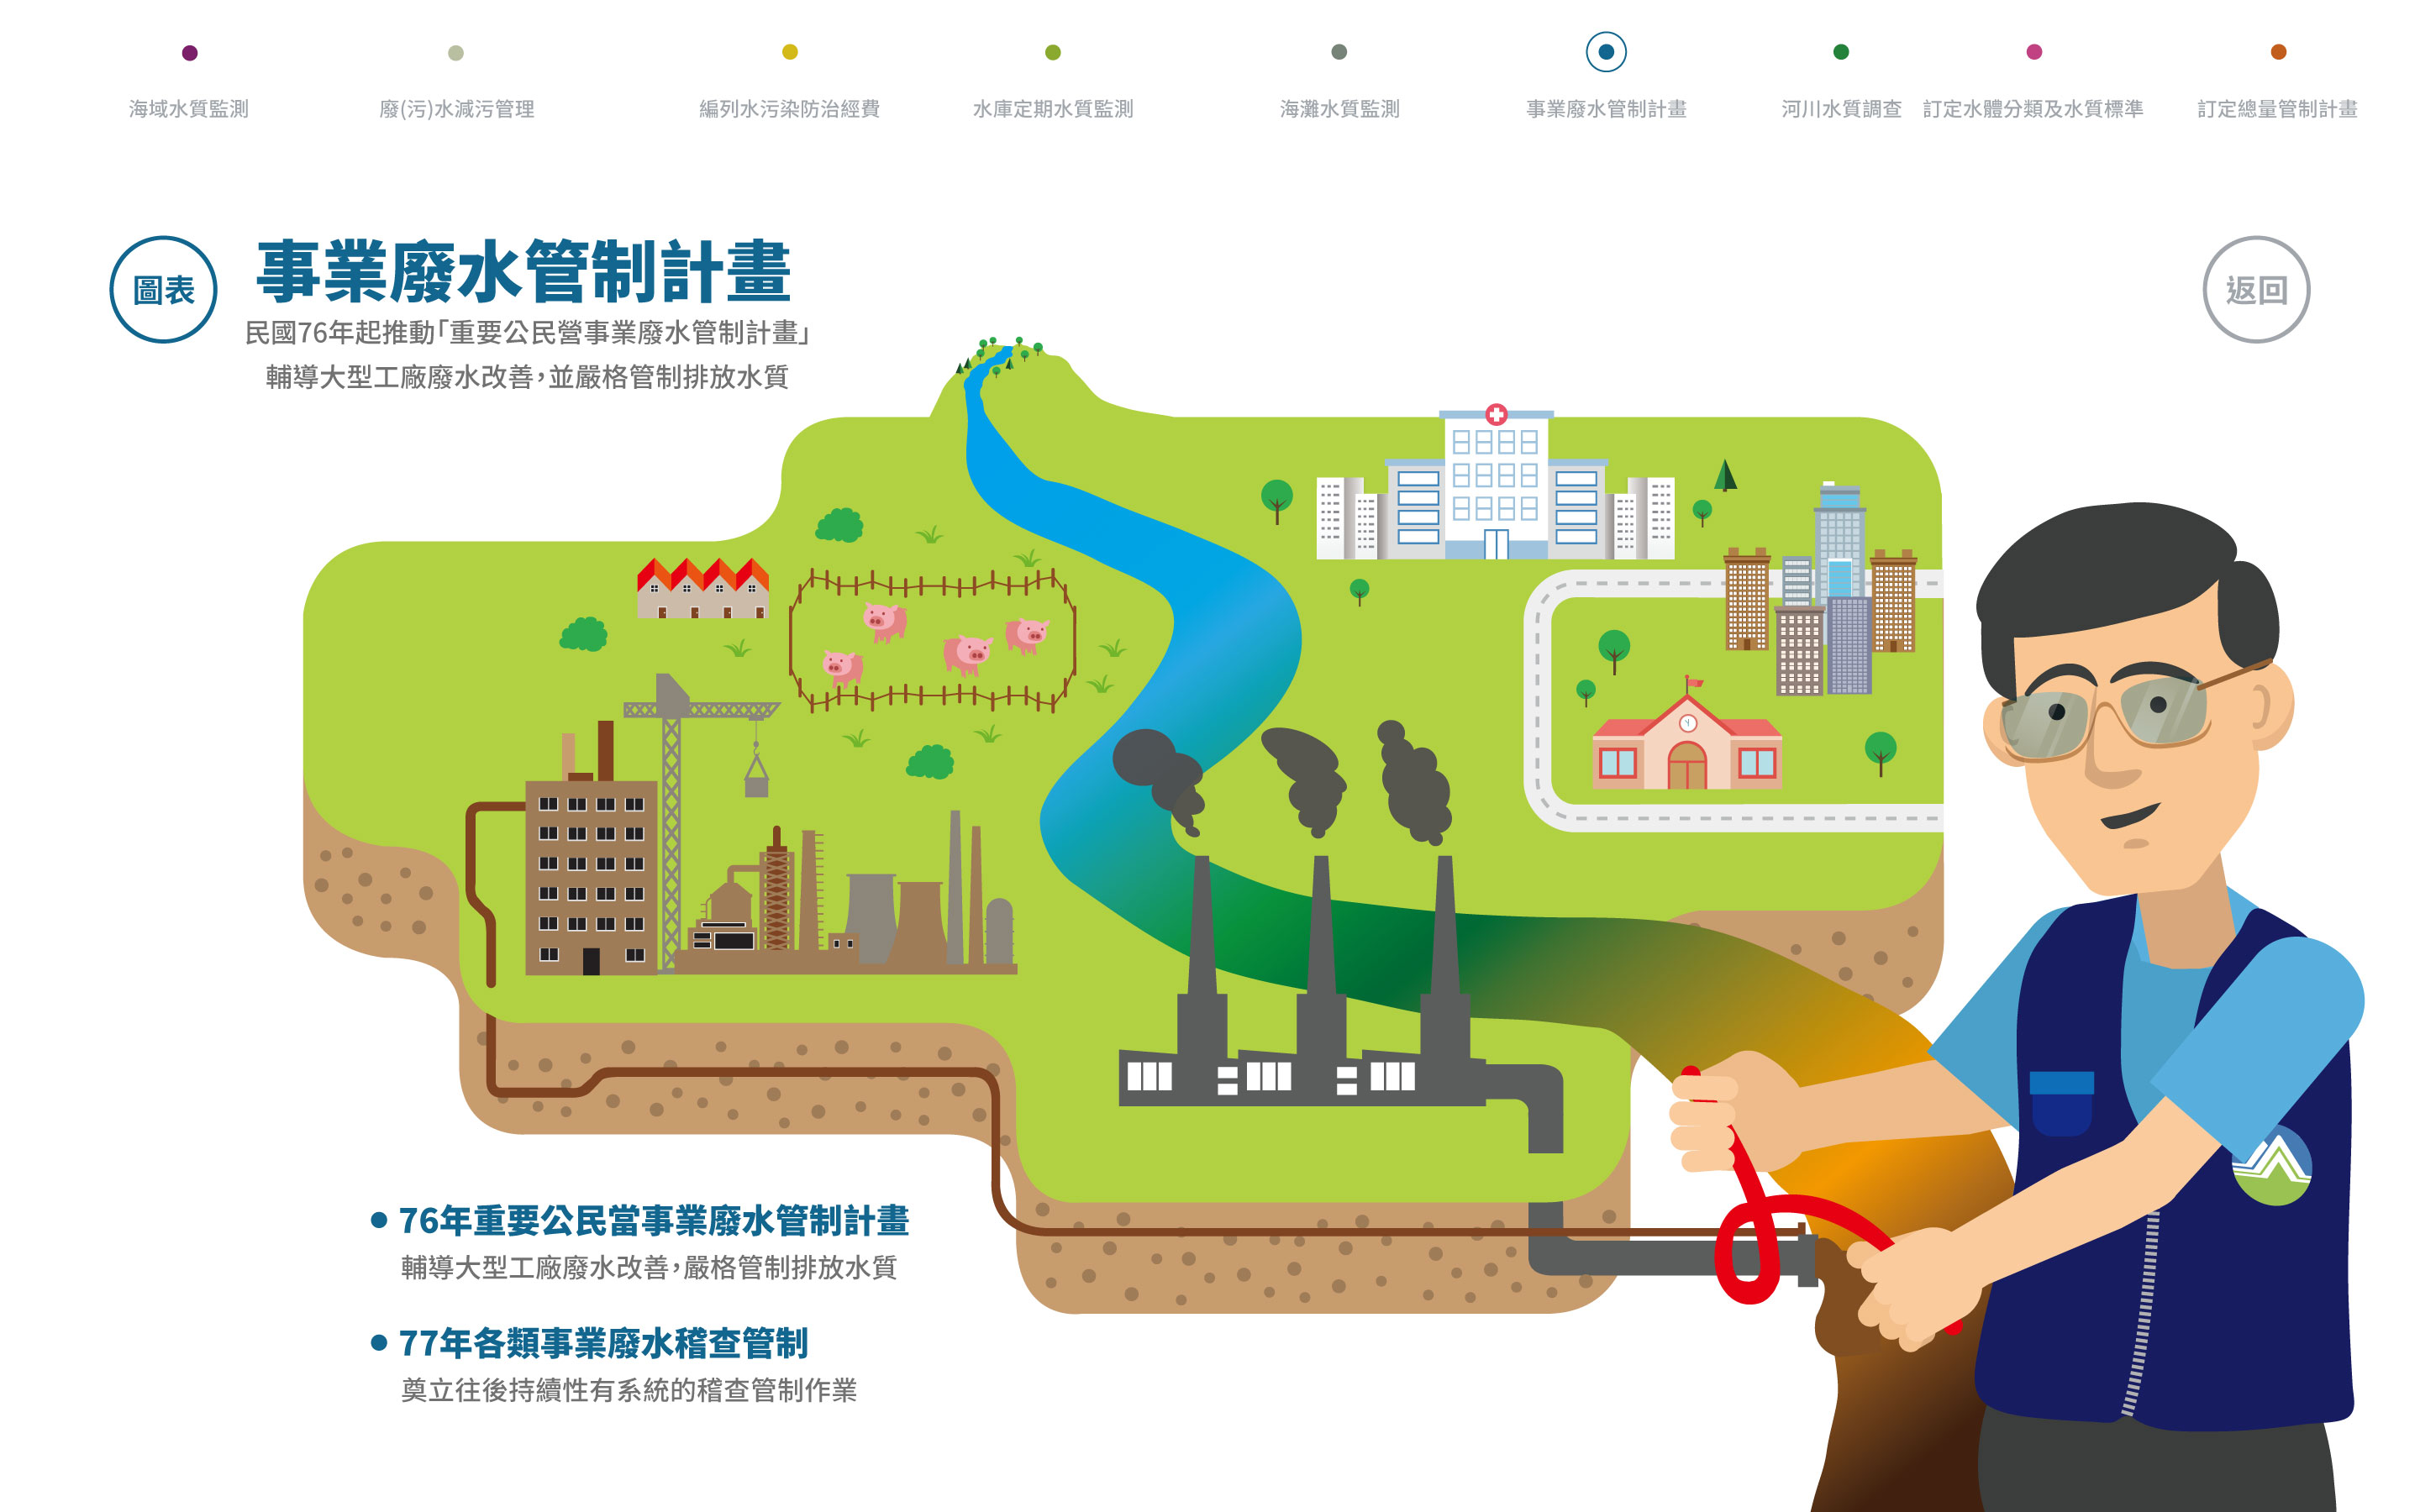
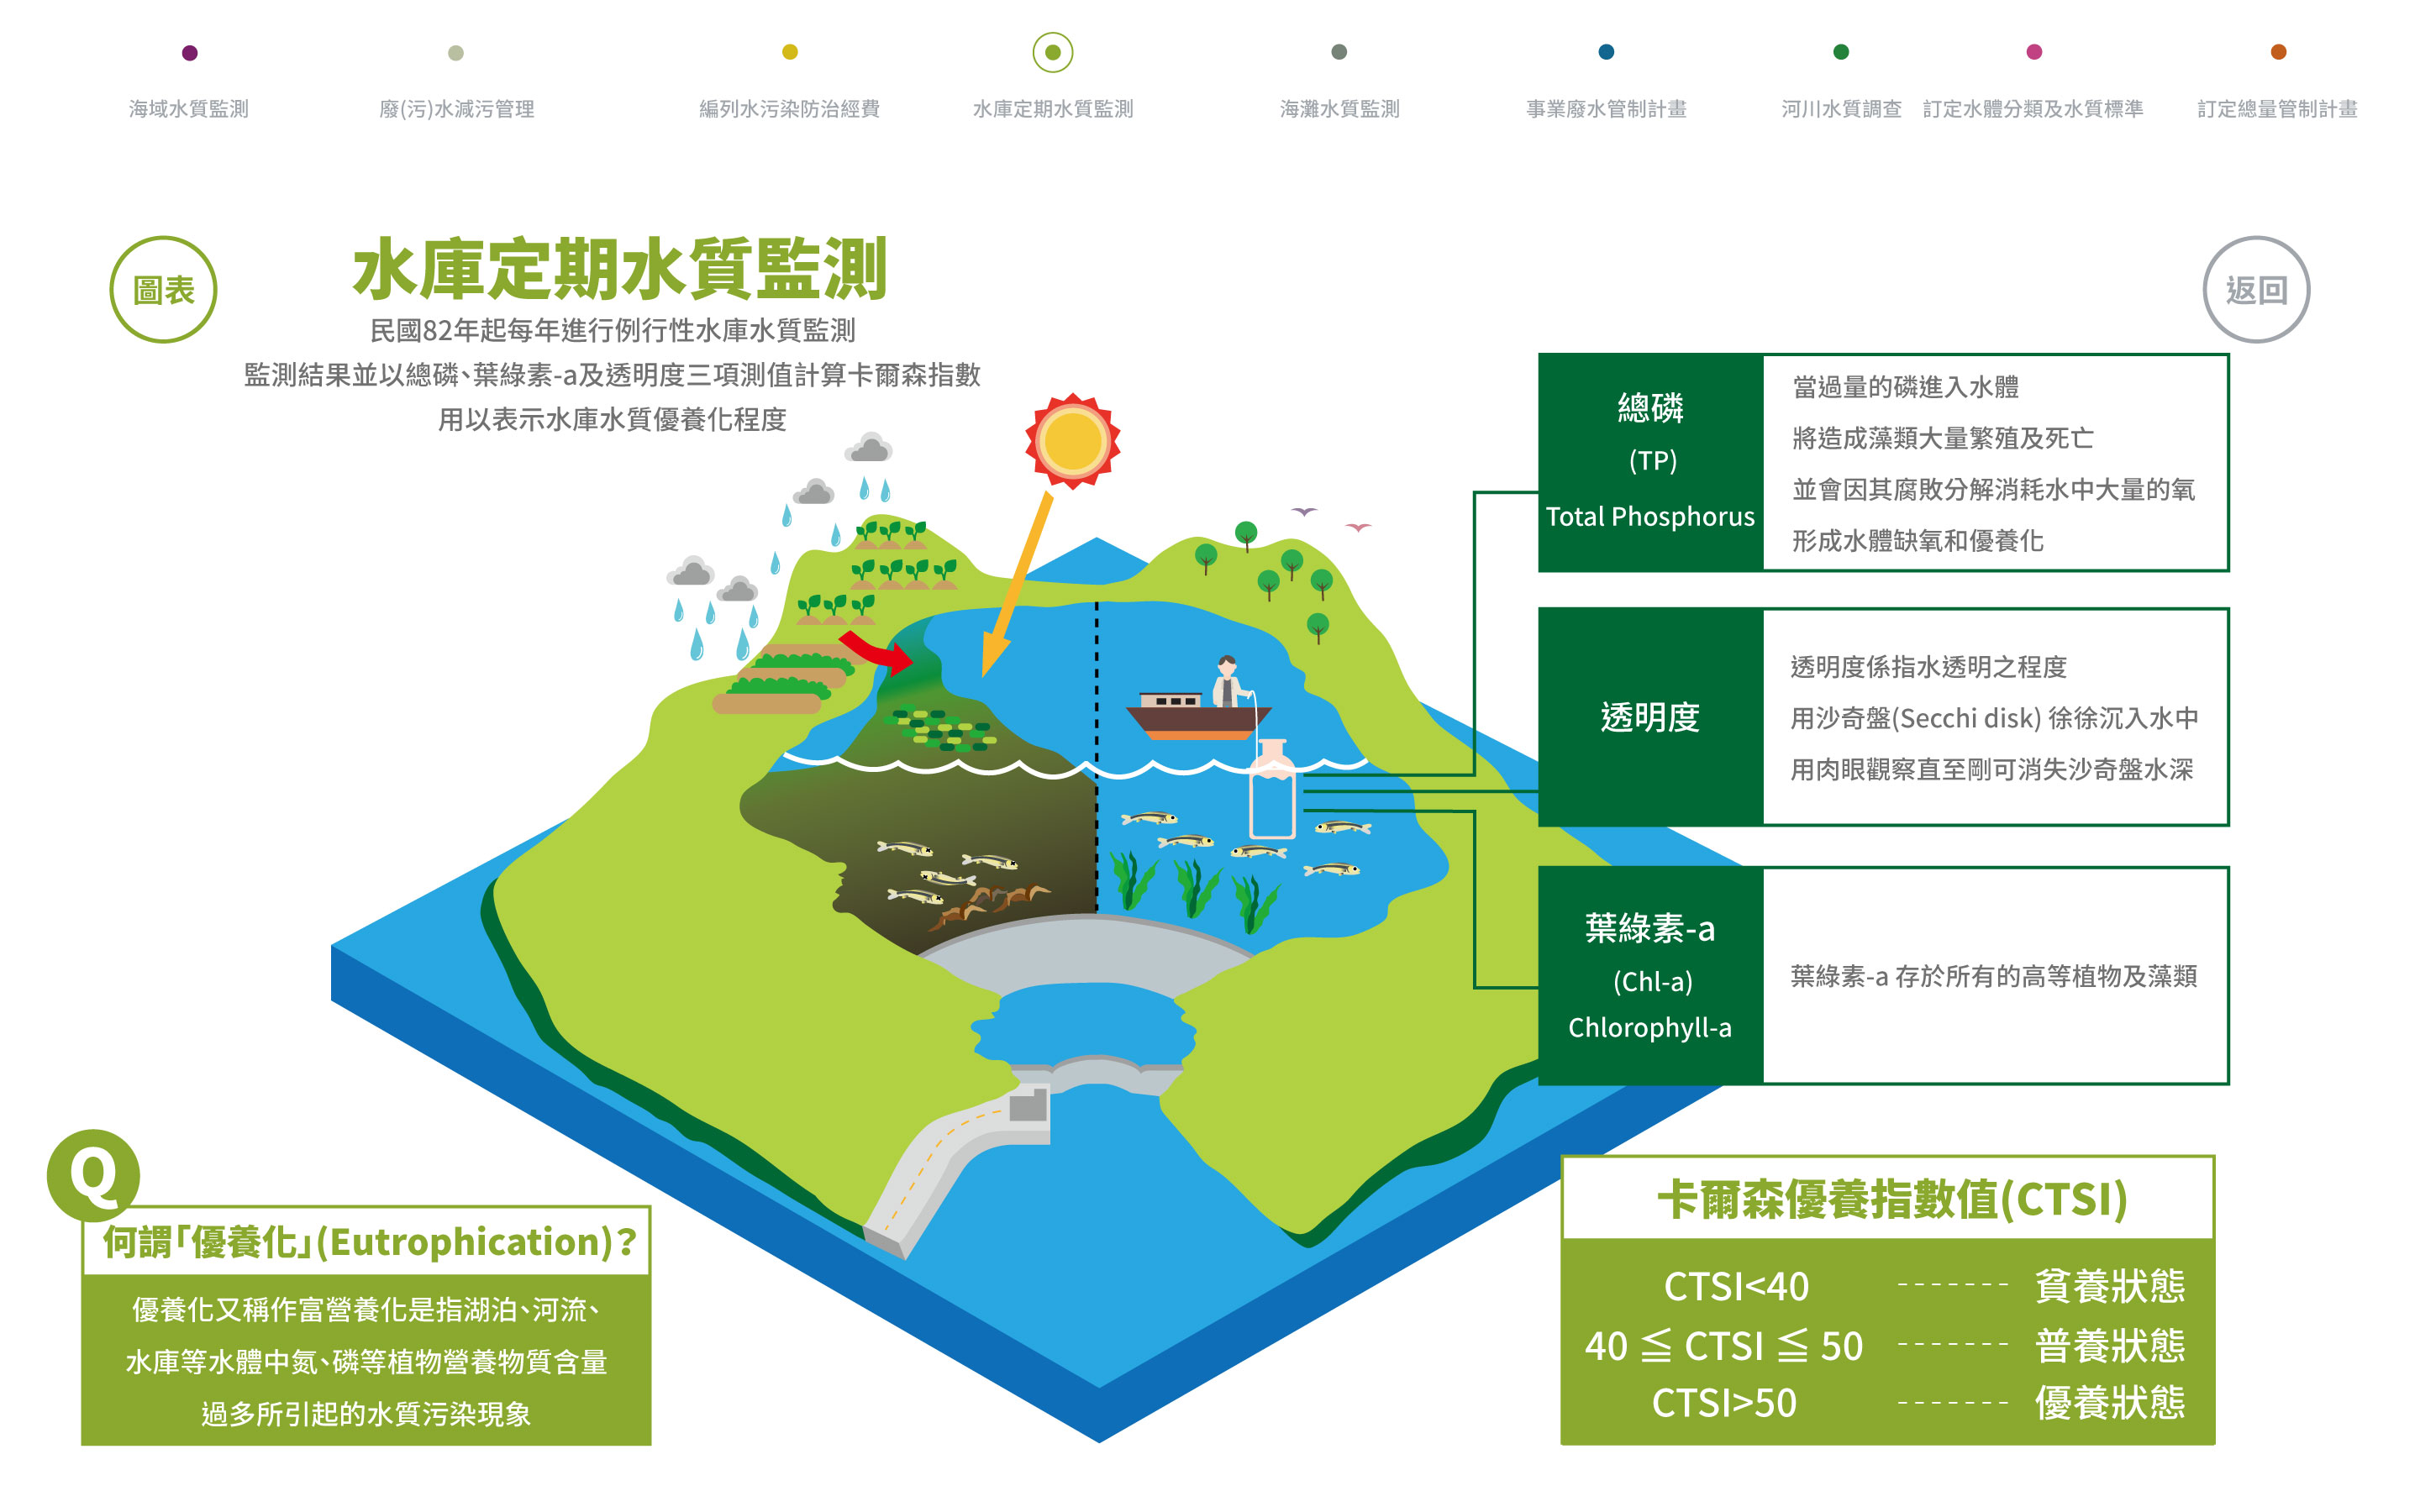
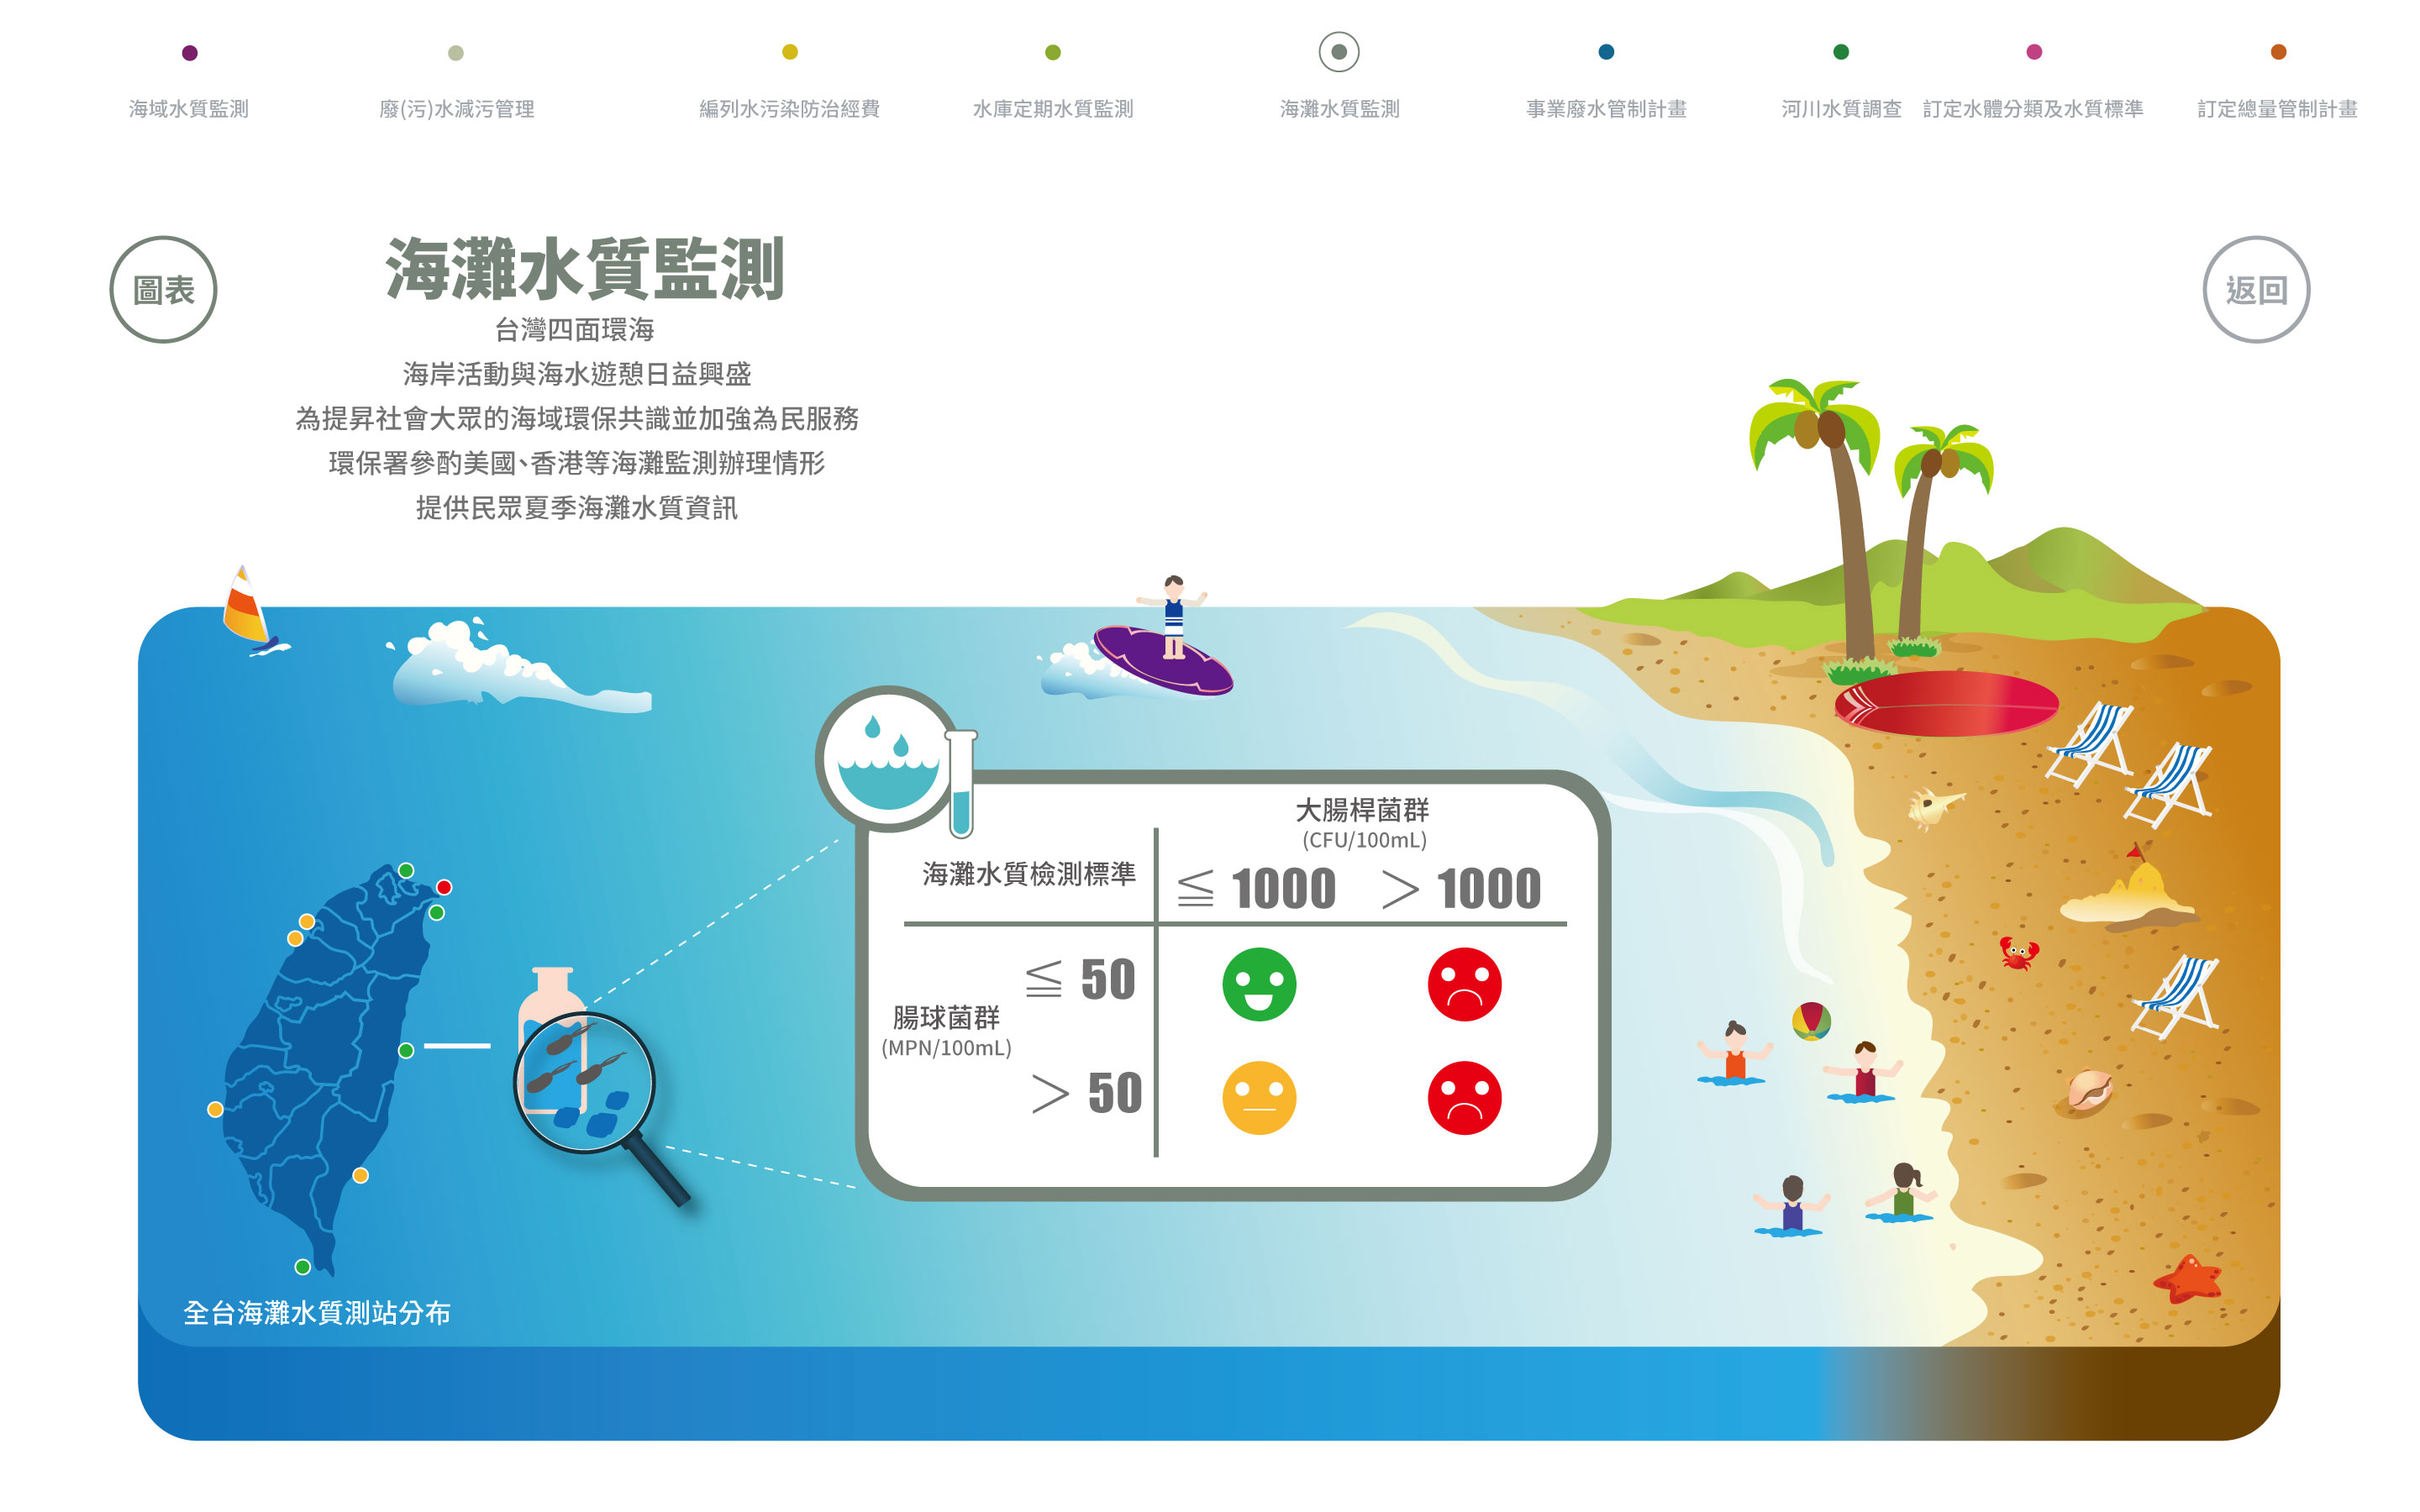
Develop visualization data like an infographic for topics such as air pollution control act and water pollution control act.
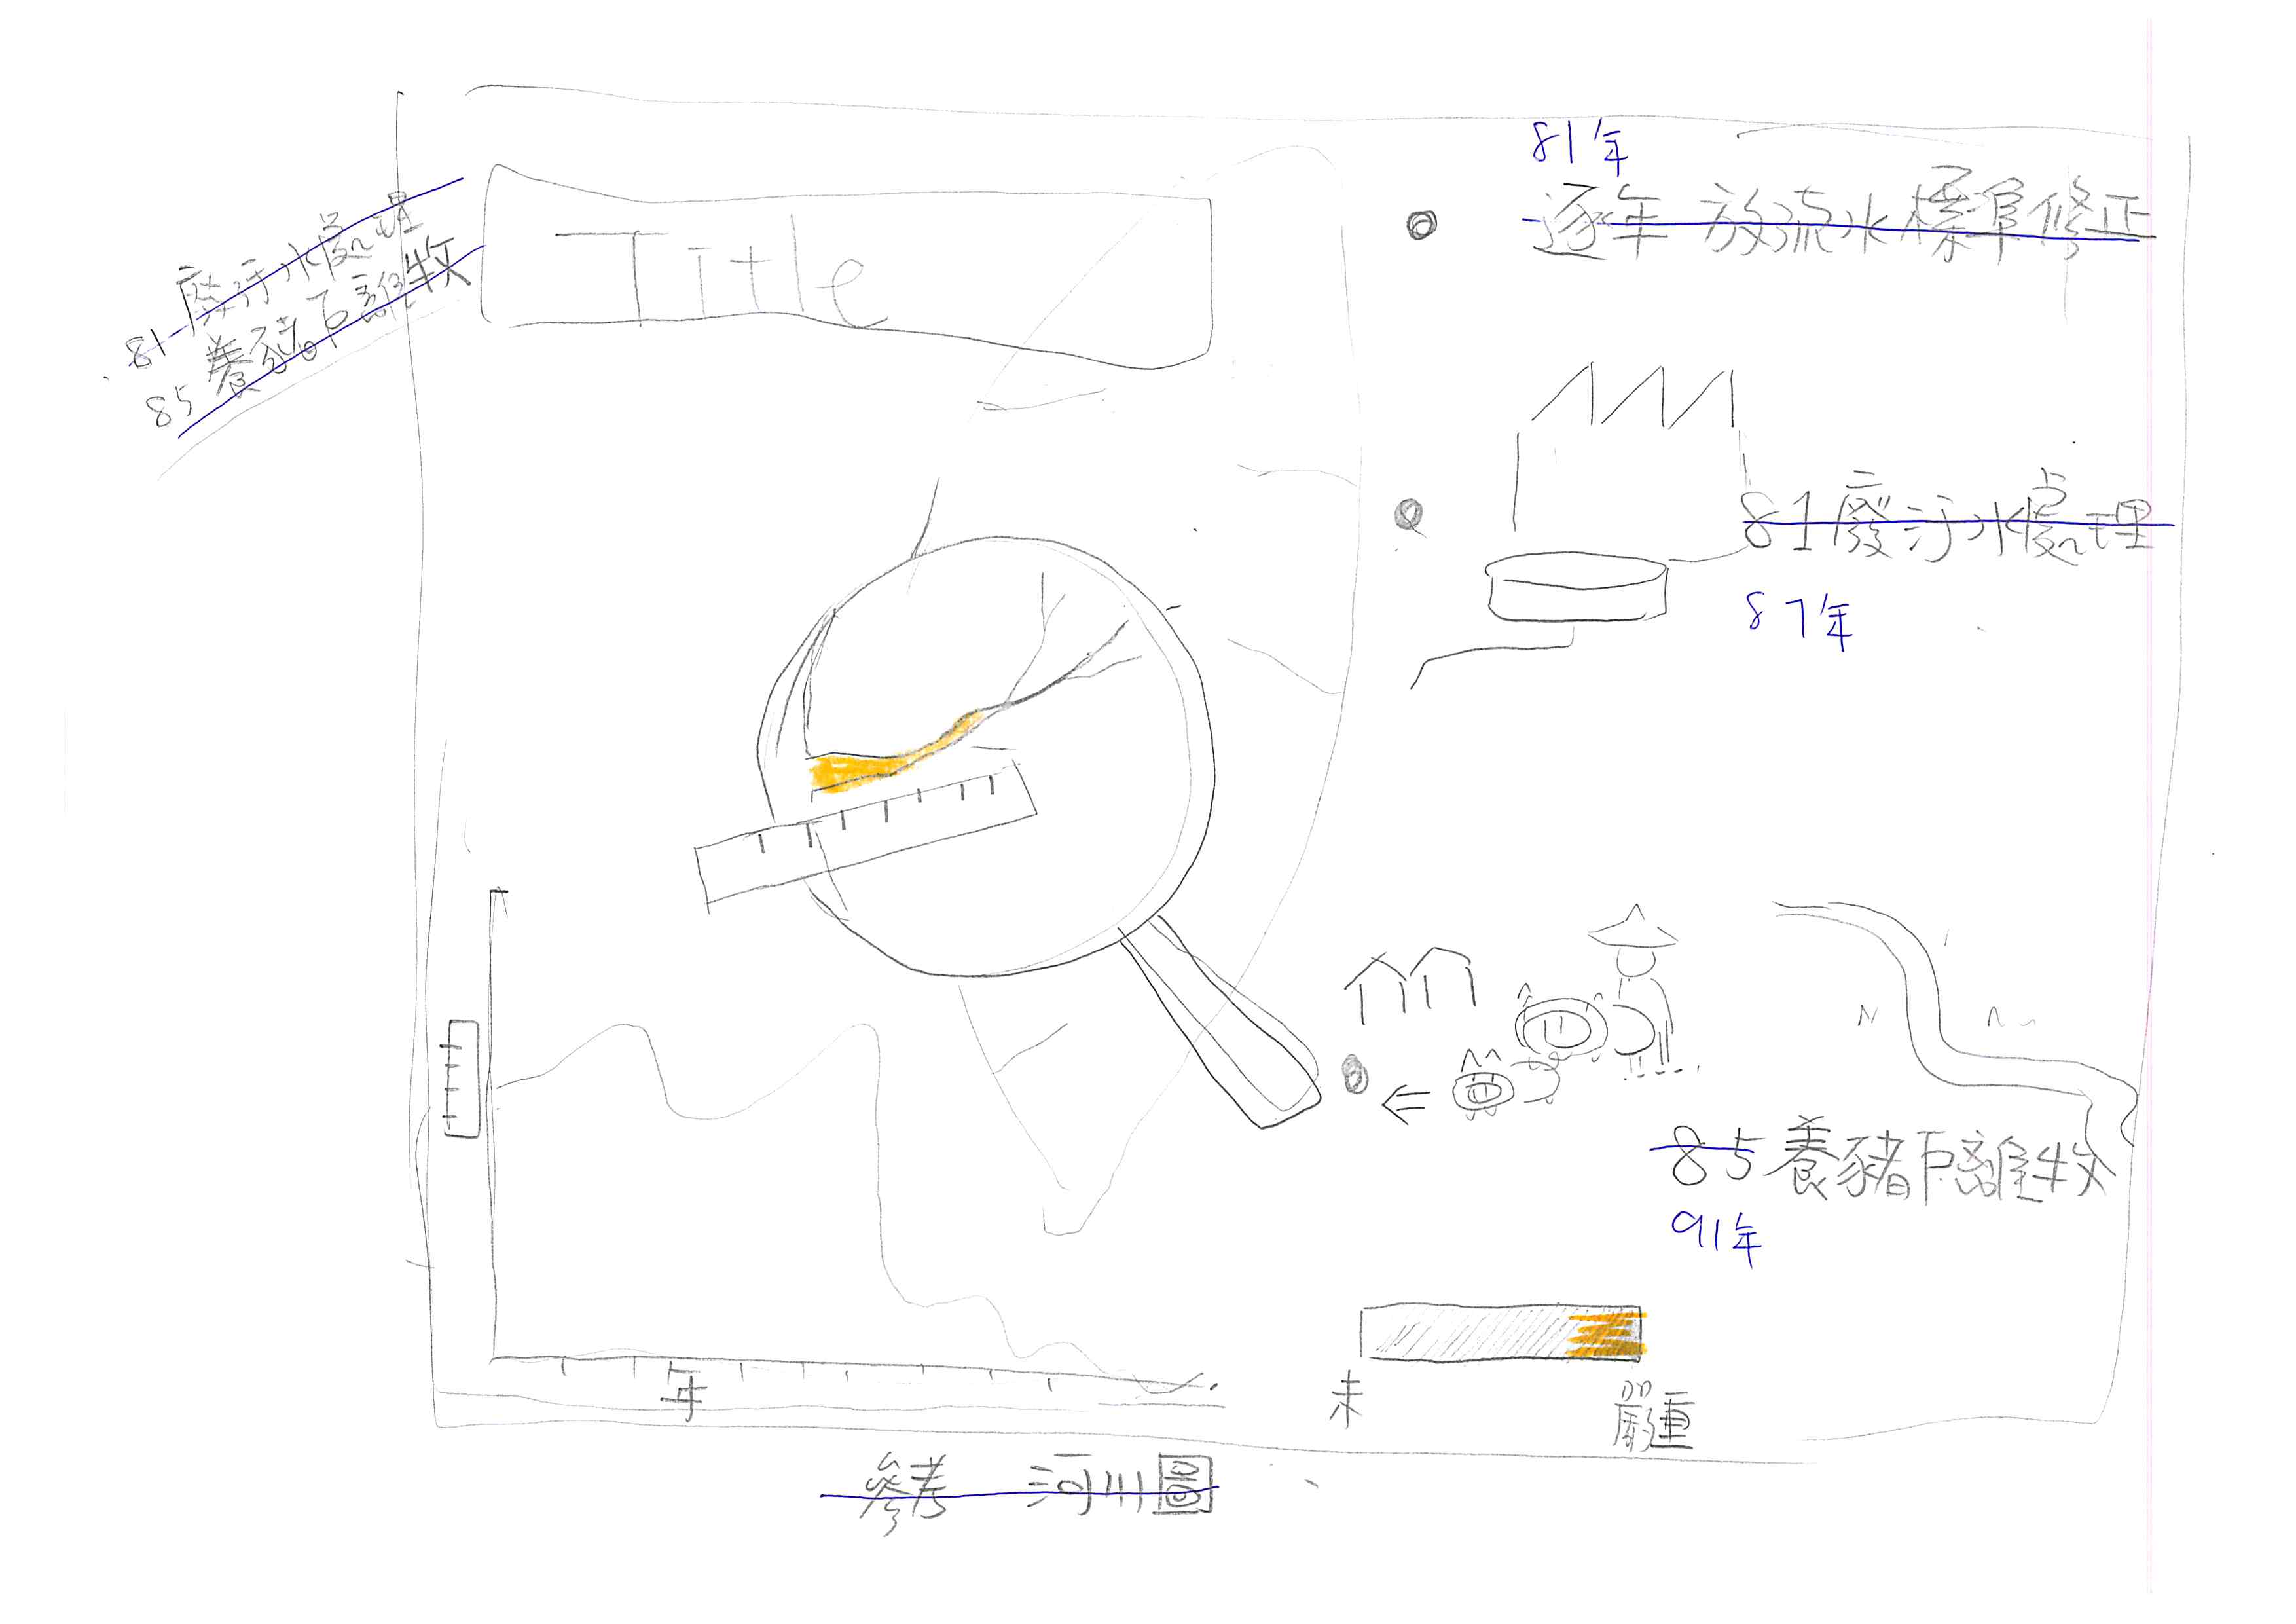
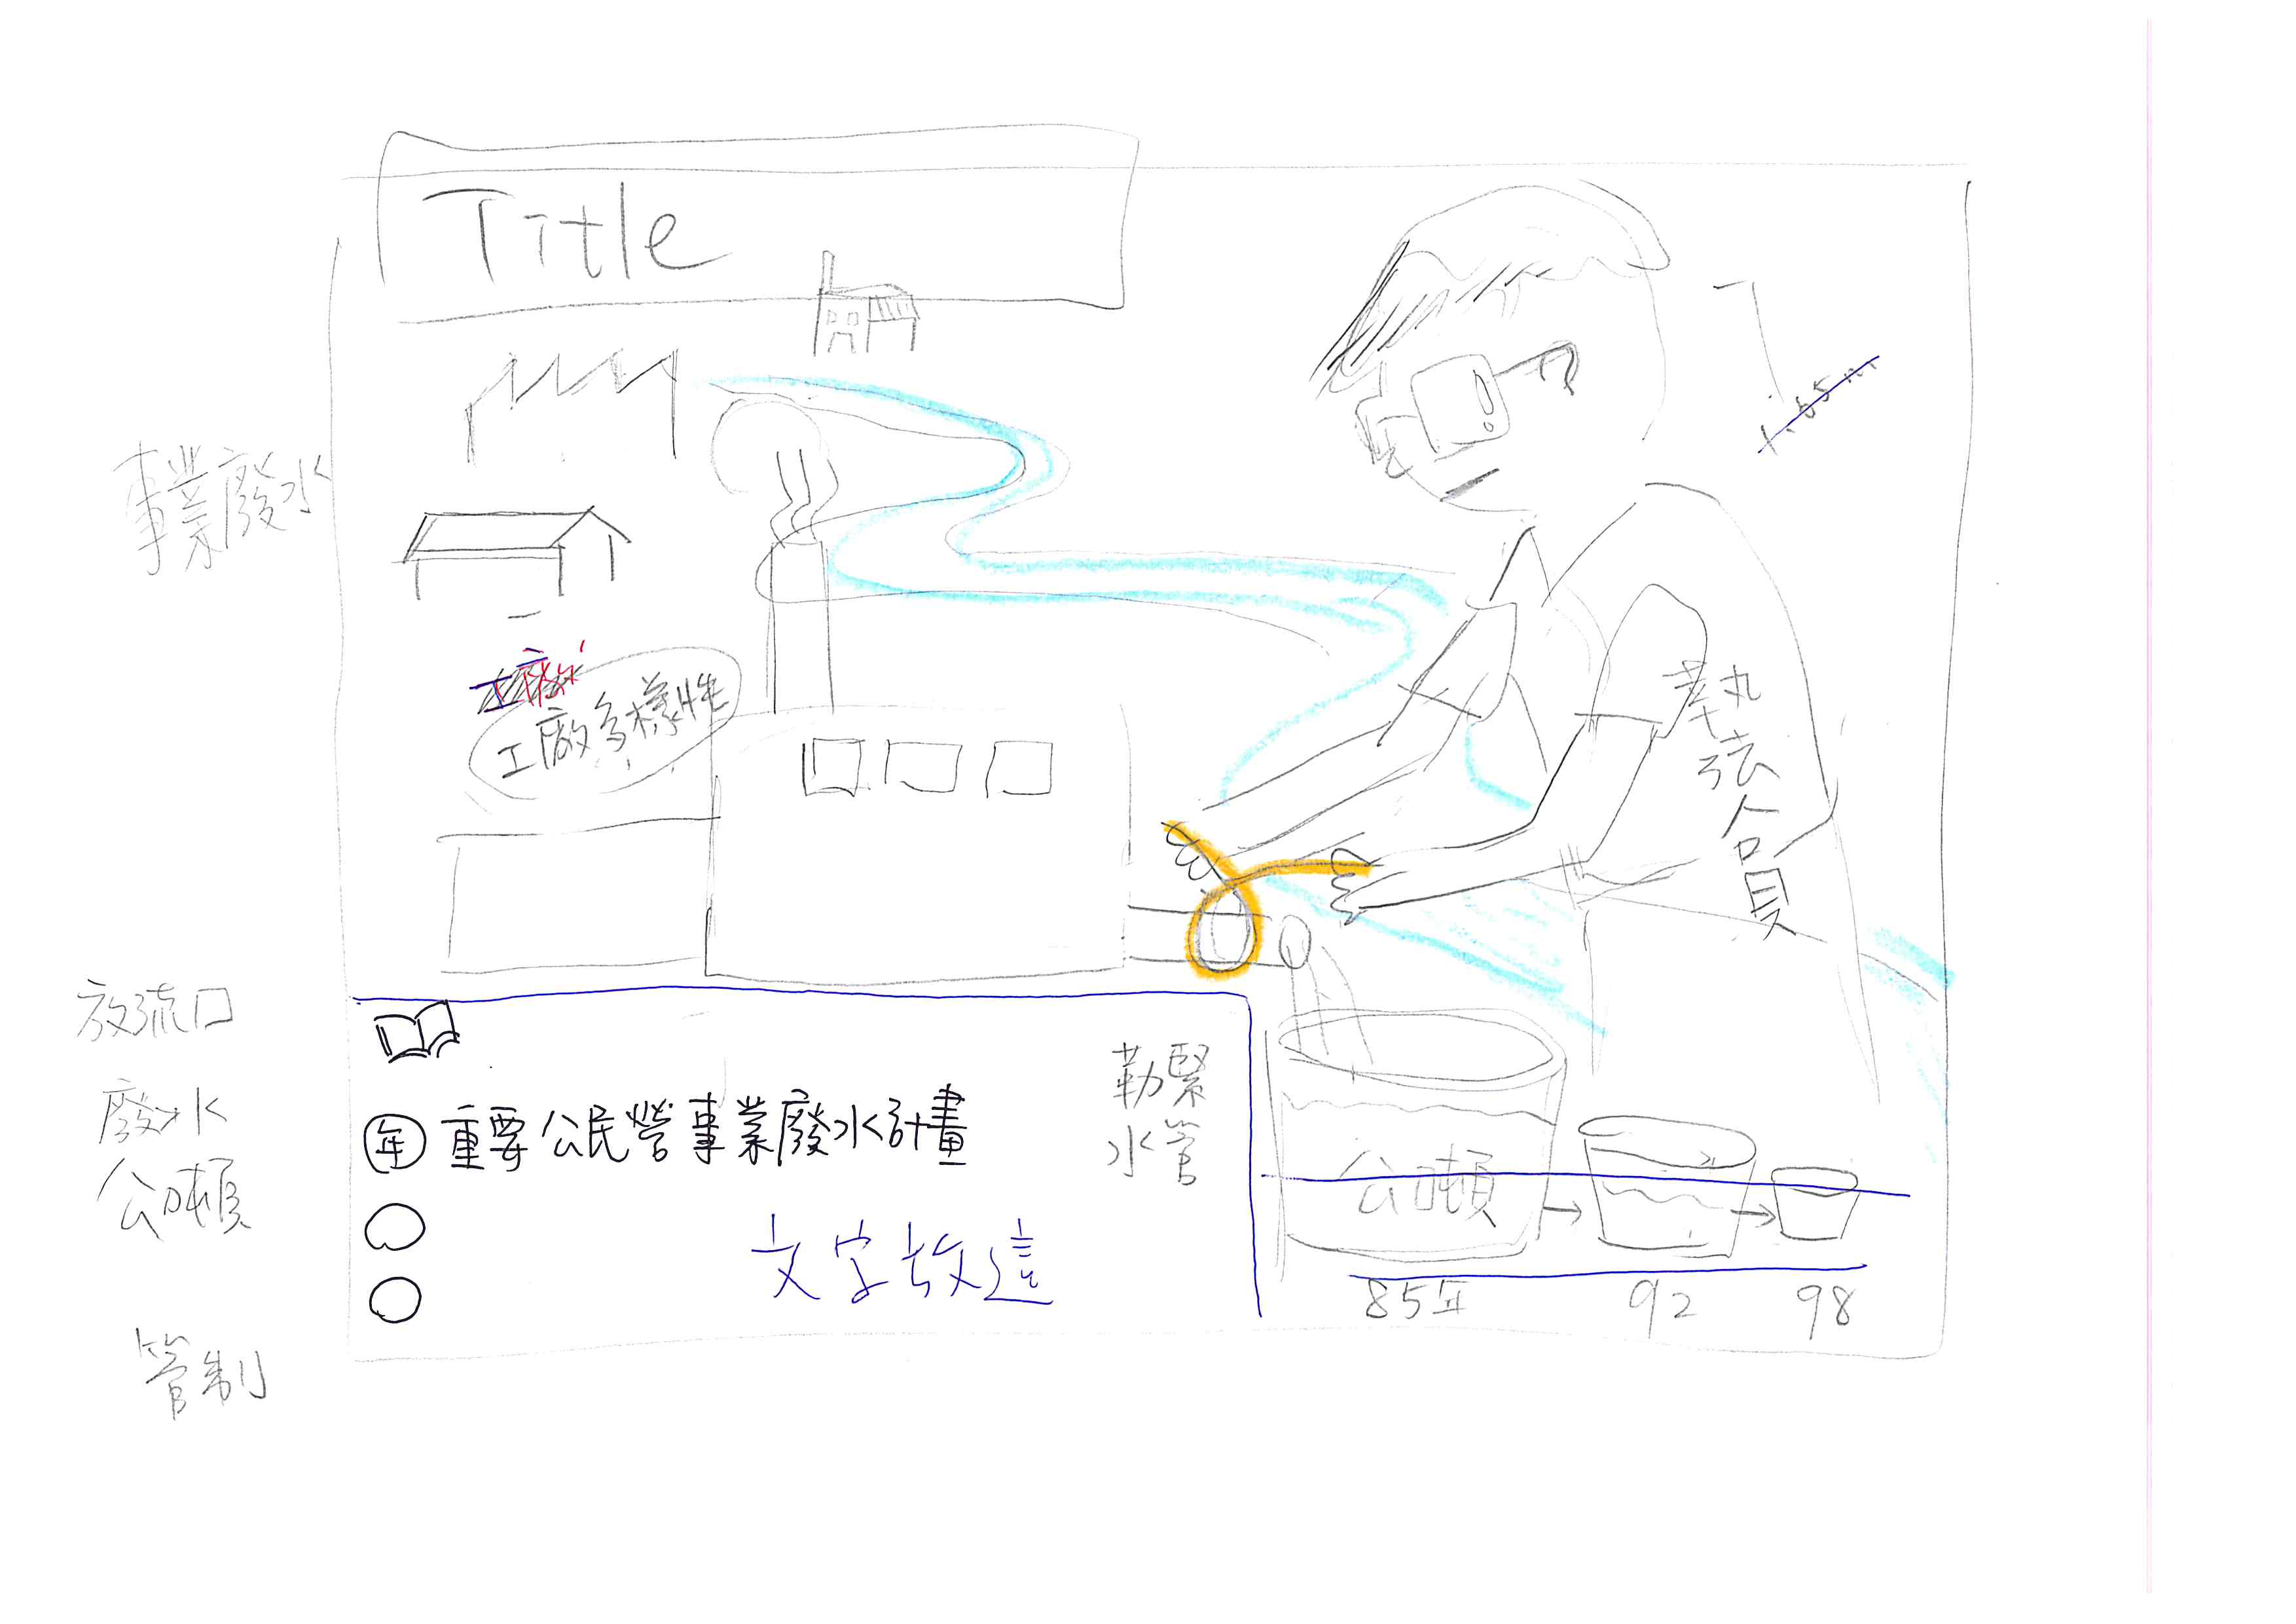

水減污管理b.jpg)
HIGH FIDELITY DESIGN
Prototyping for Home
Using GIS to create a website in accordance with usability and responsive web design (RWD).


HIGH FIDELITY DESIGN
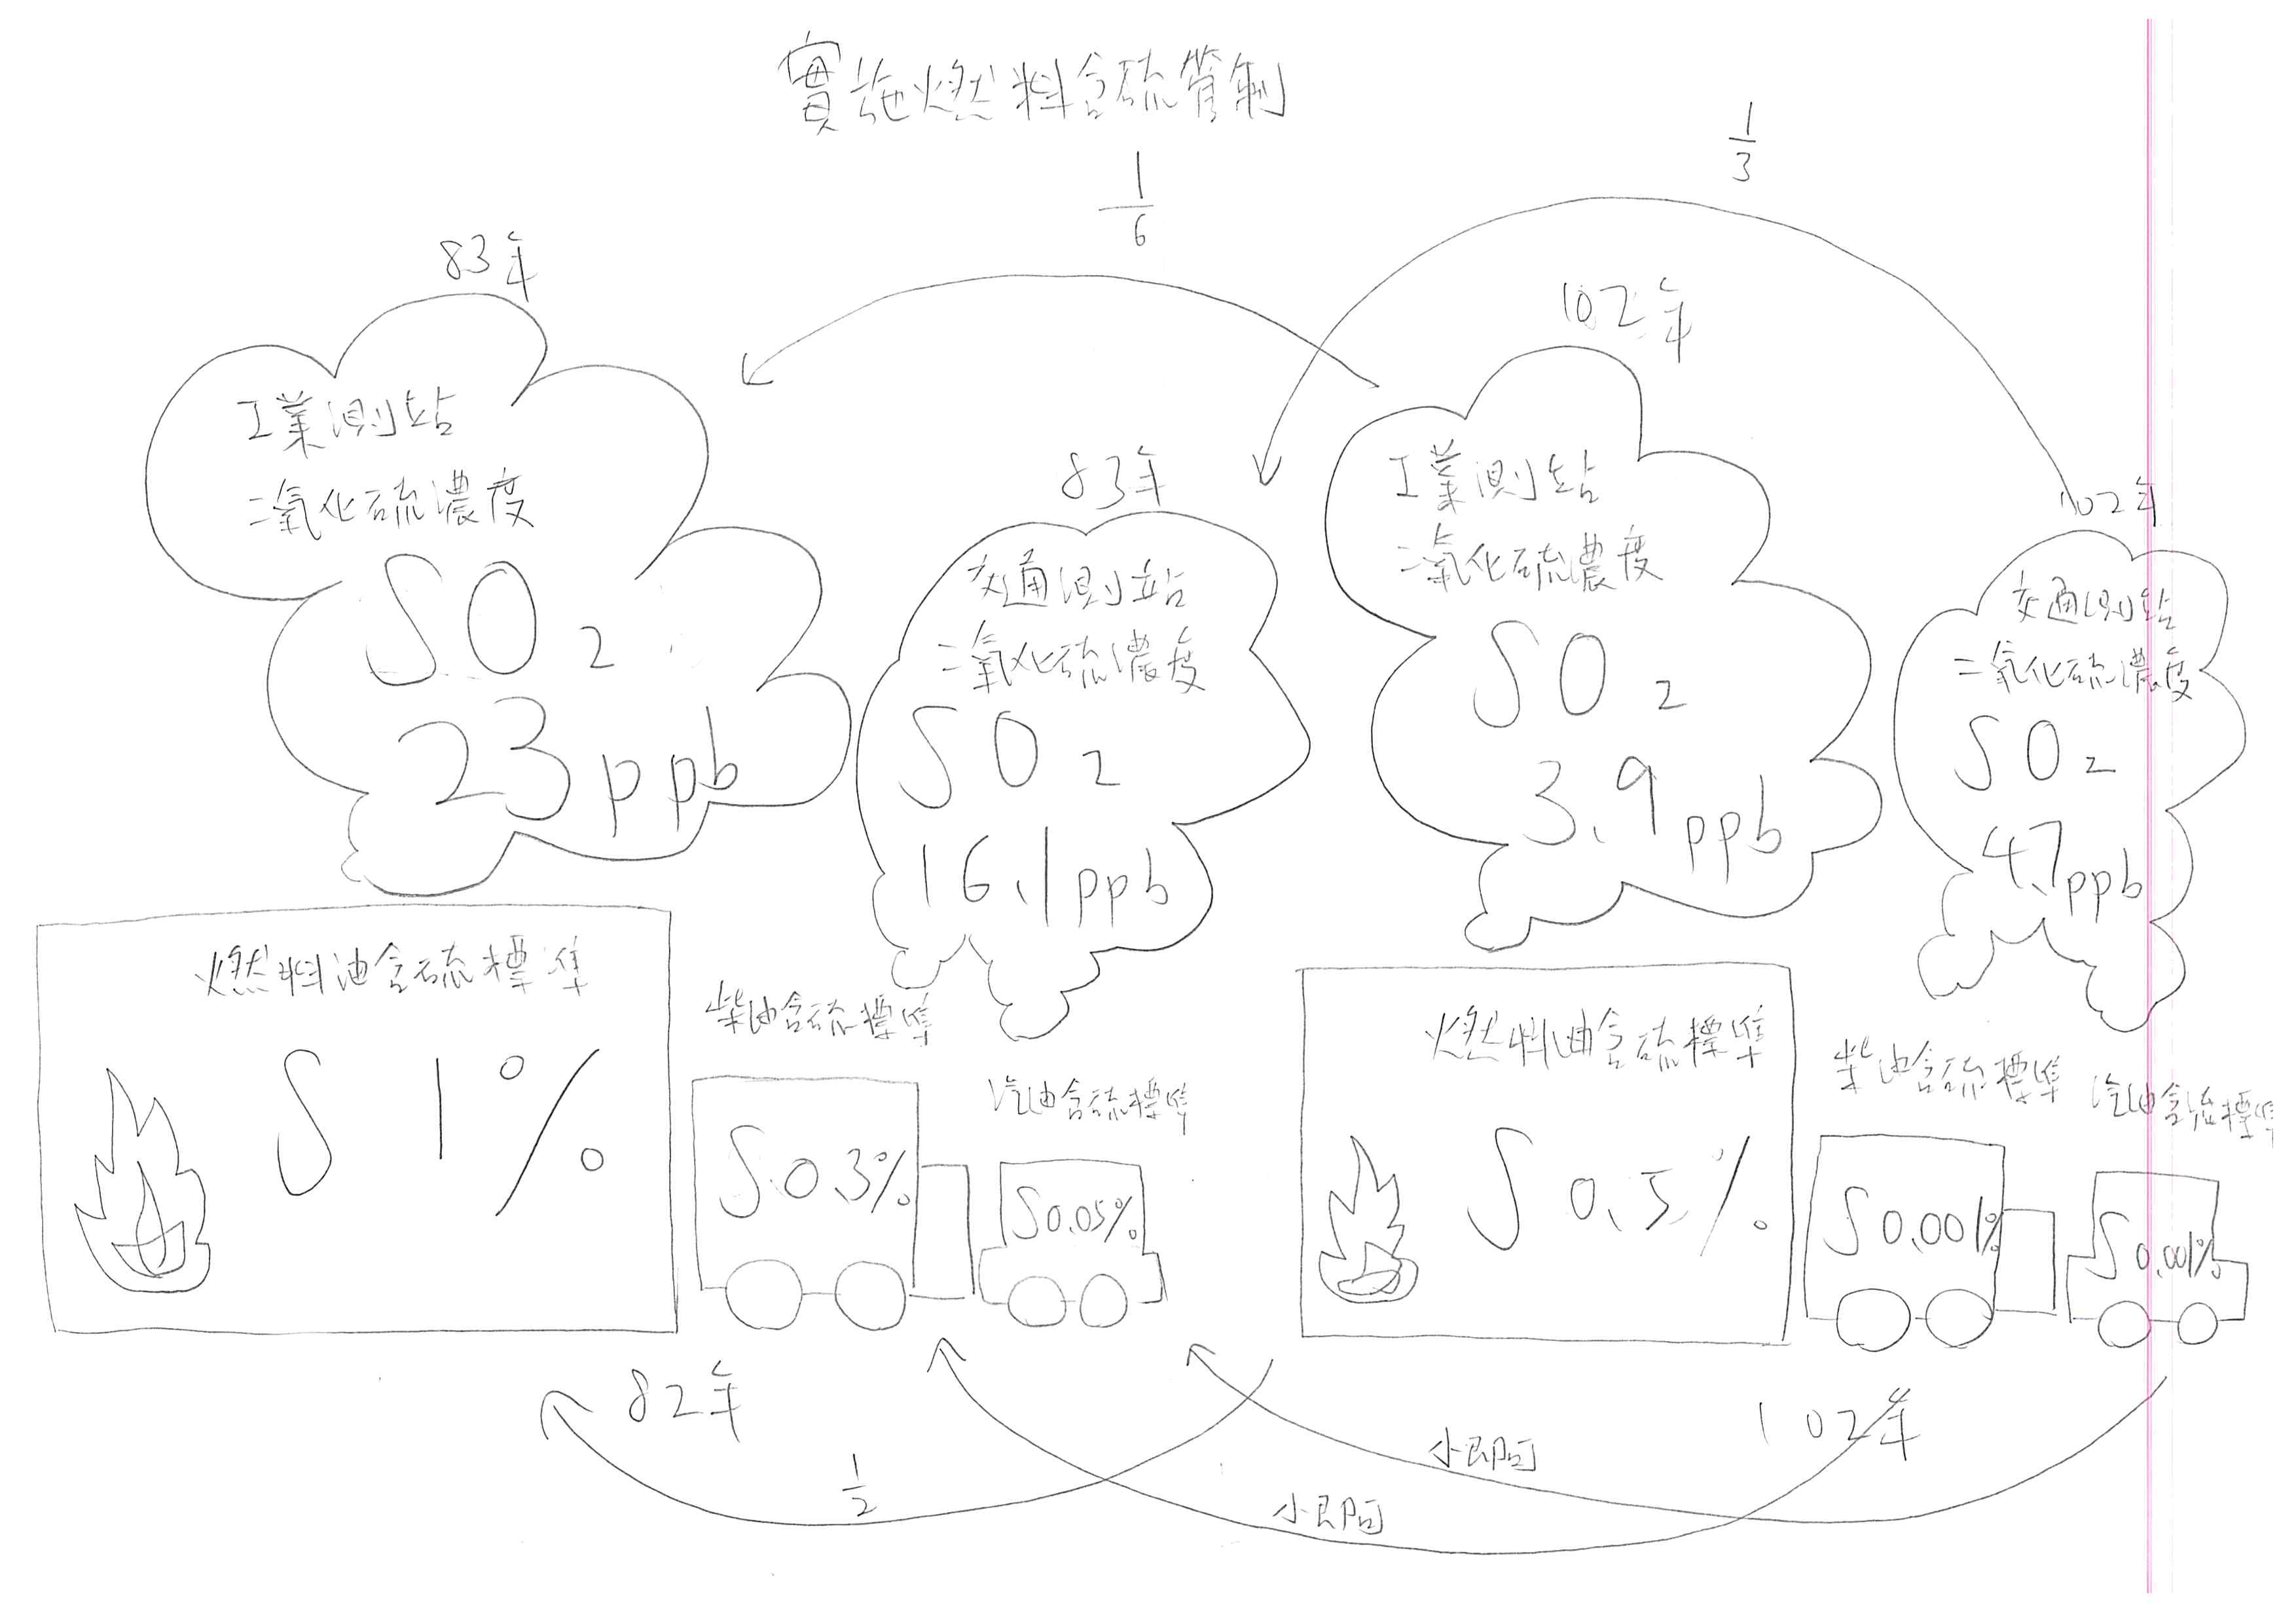
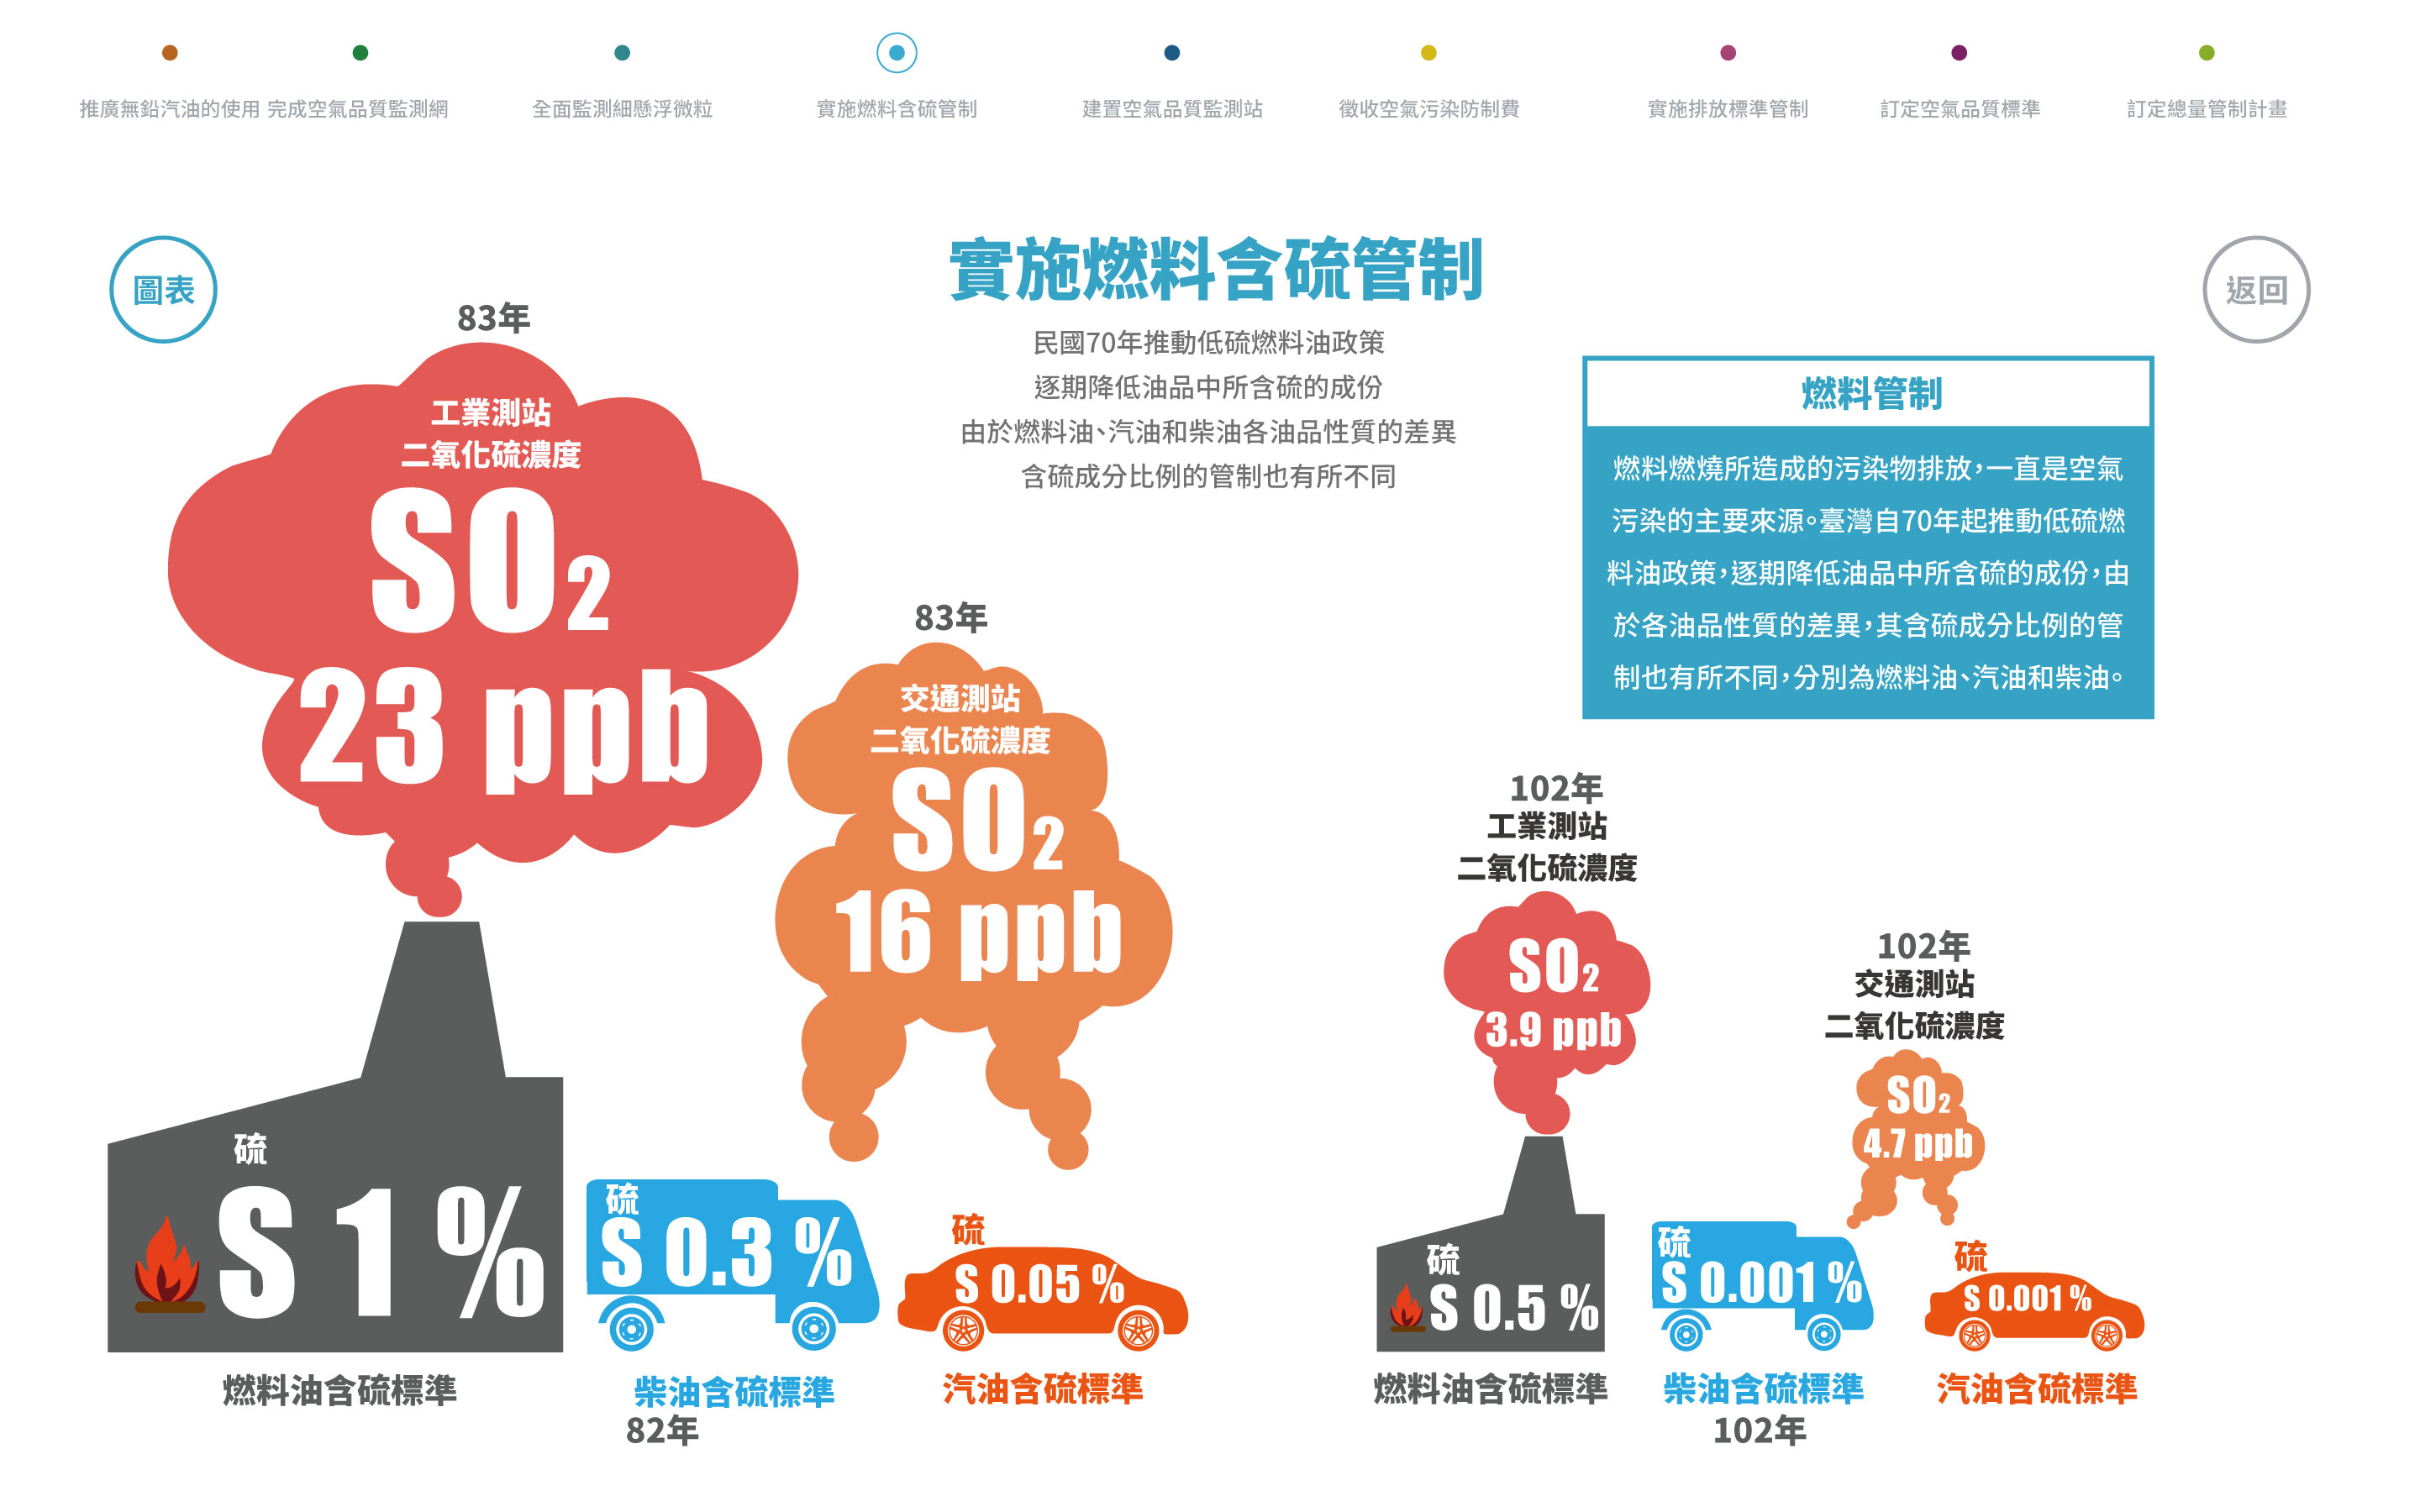
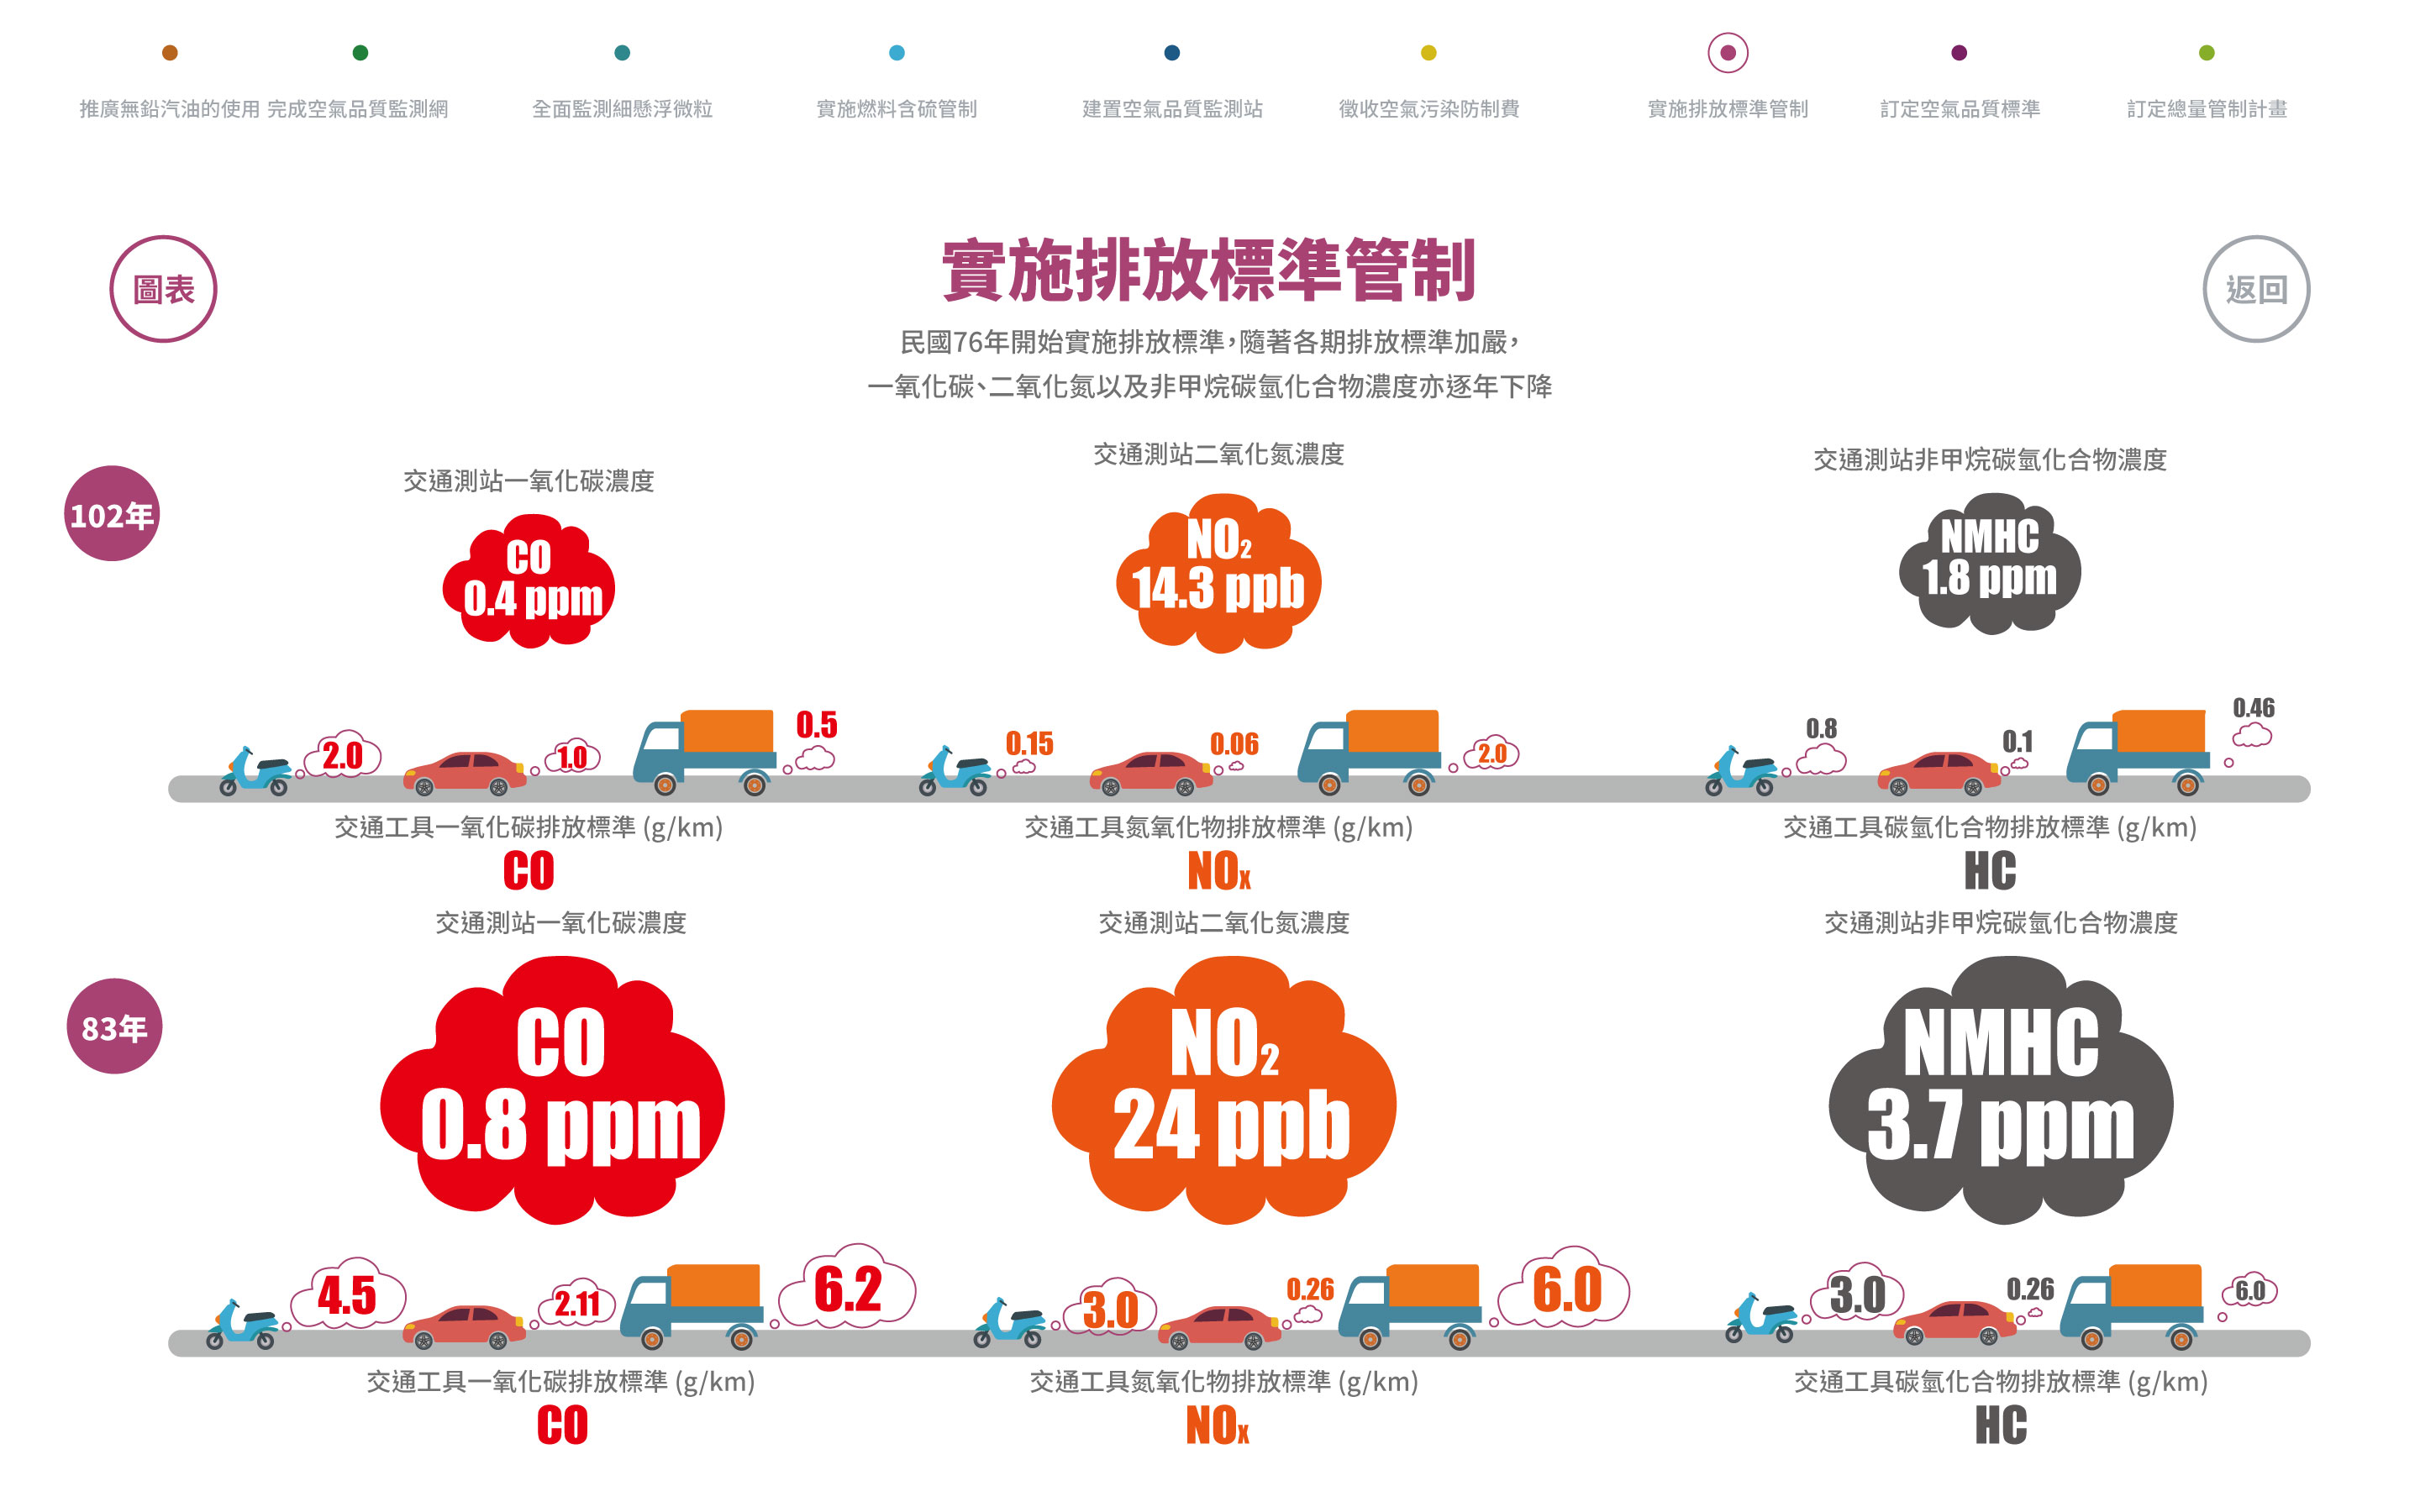
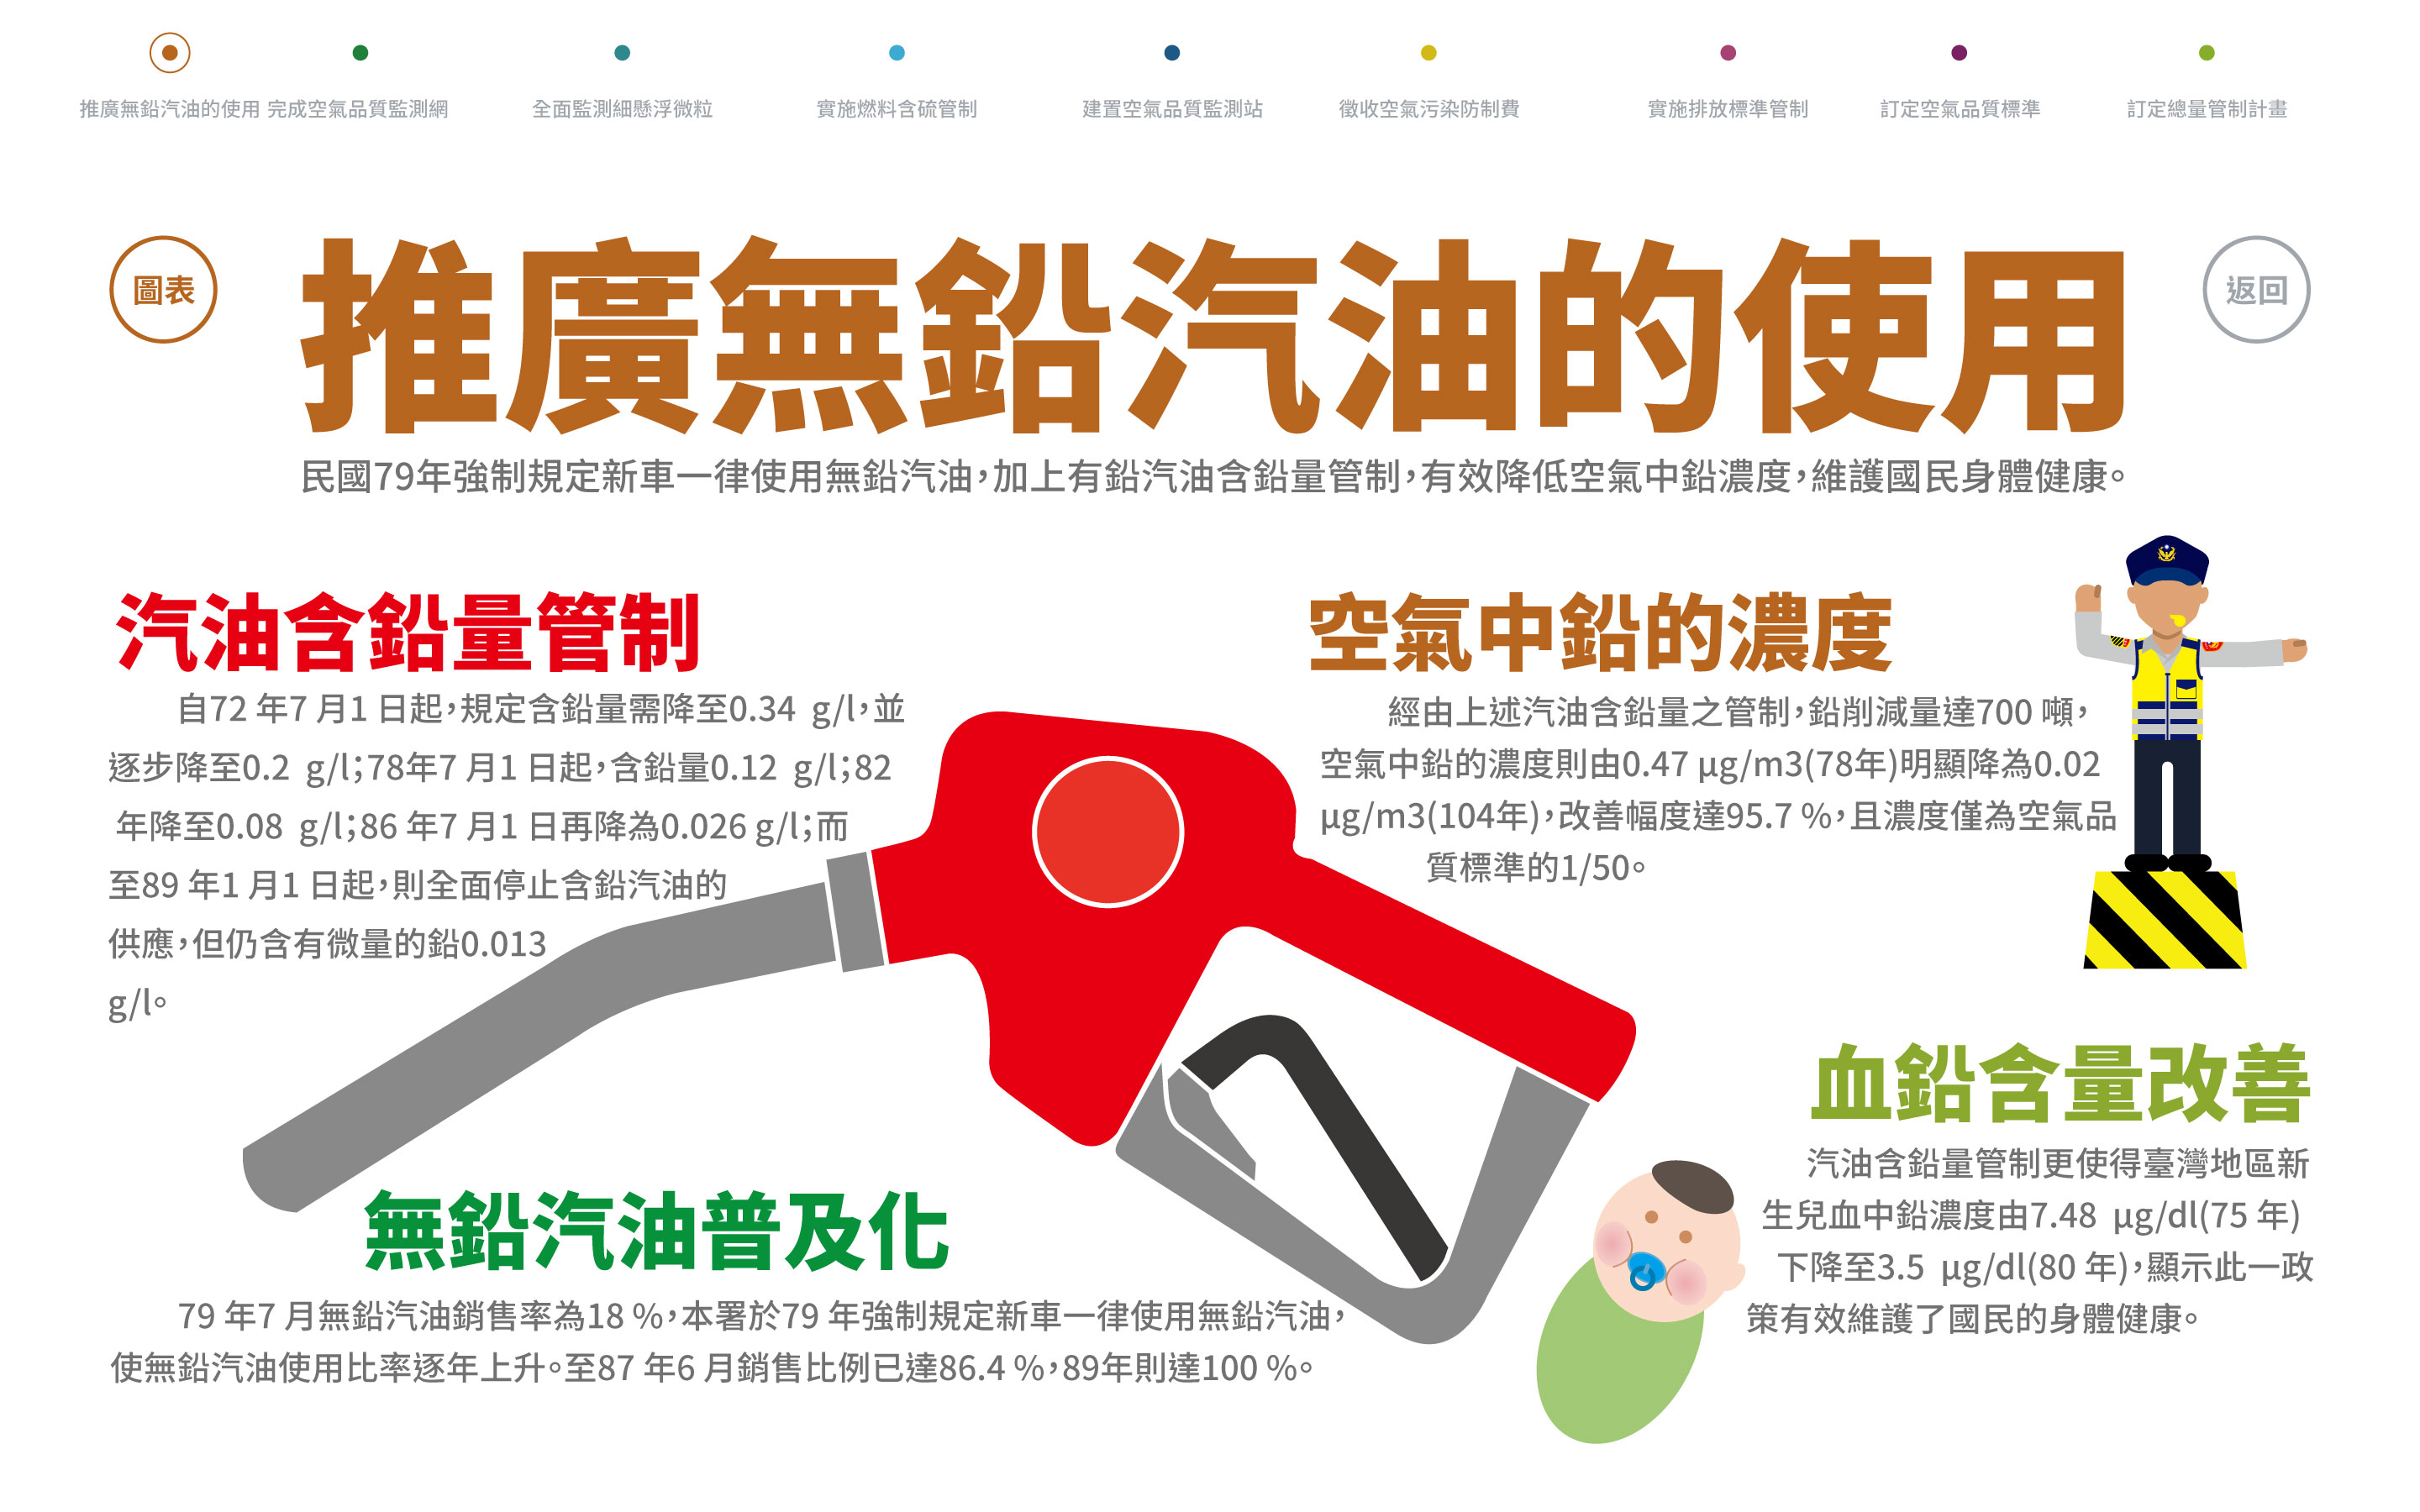
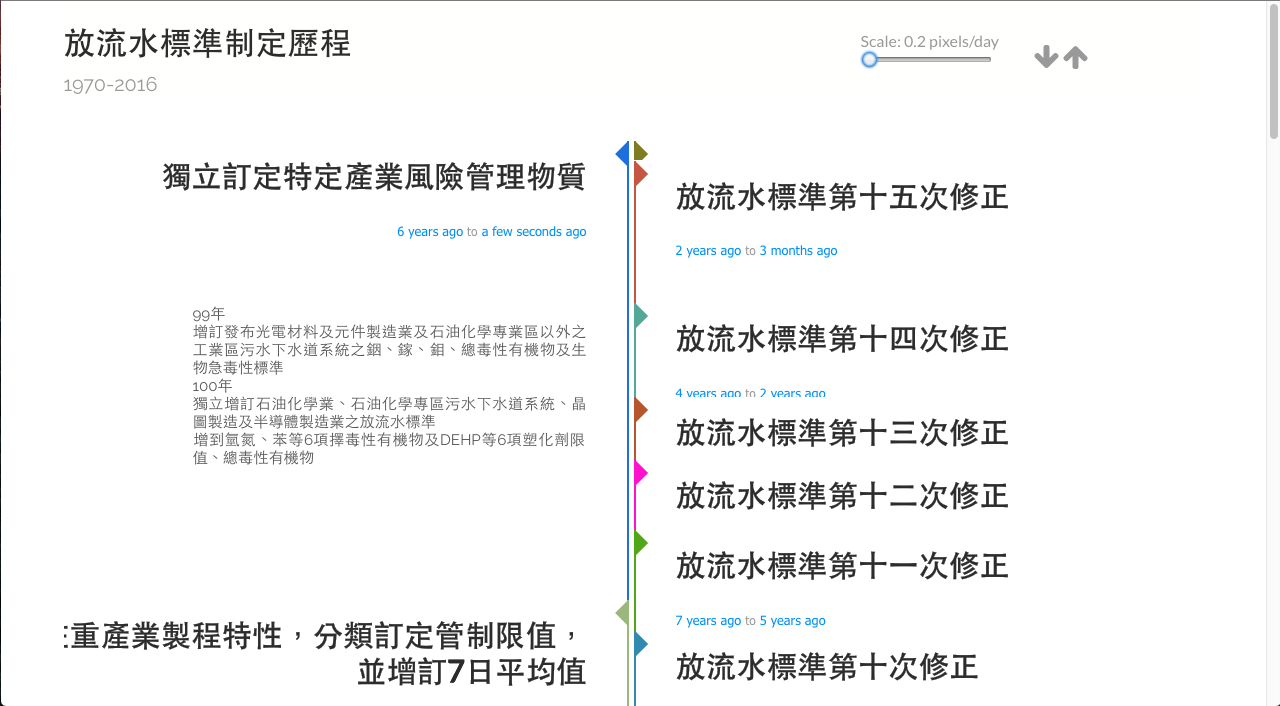
Prototyping for Infographic
Design project includes visualizing information on air pollution control act and water pollution control act in time and space dimensions.

水減污管理cb.jpg)
HIGH FIDELITY DESIGN
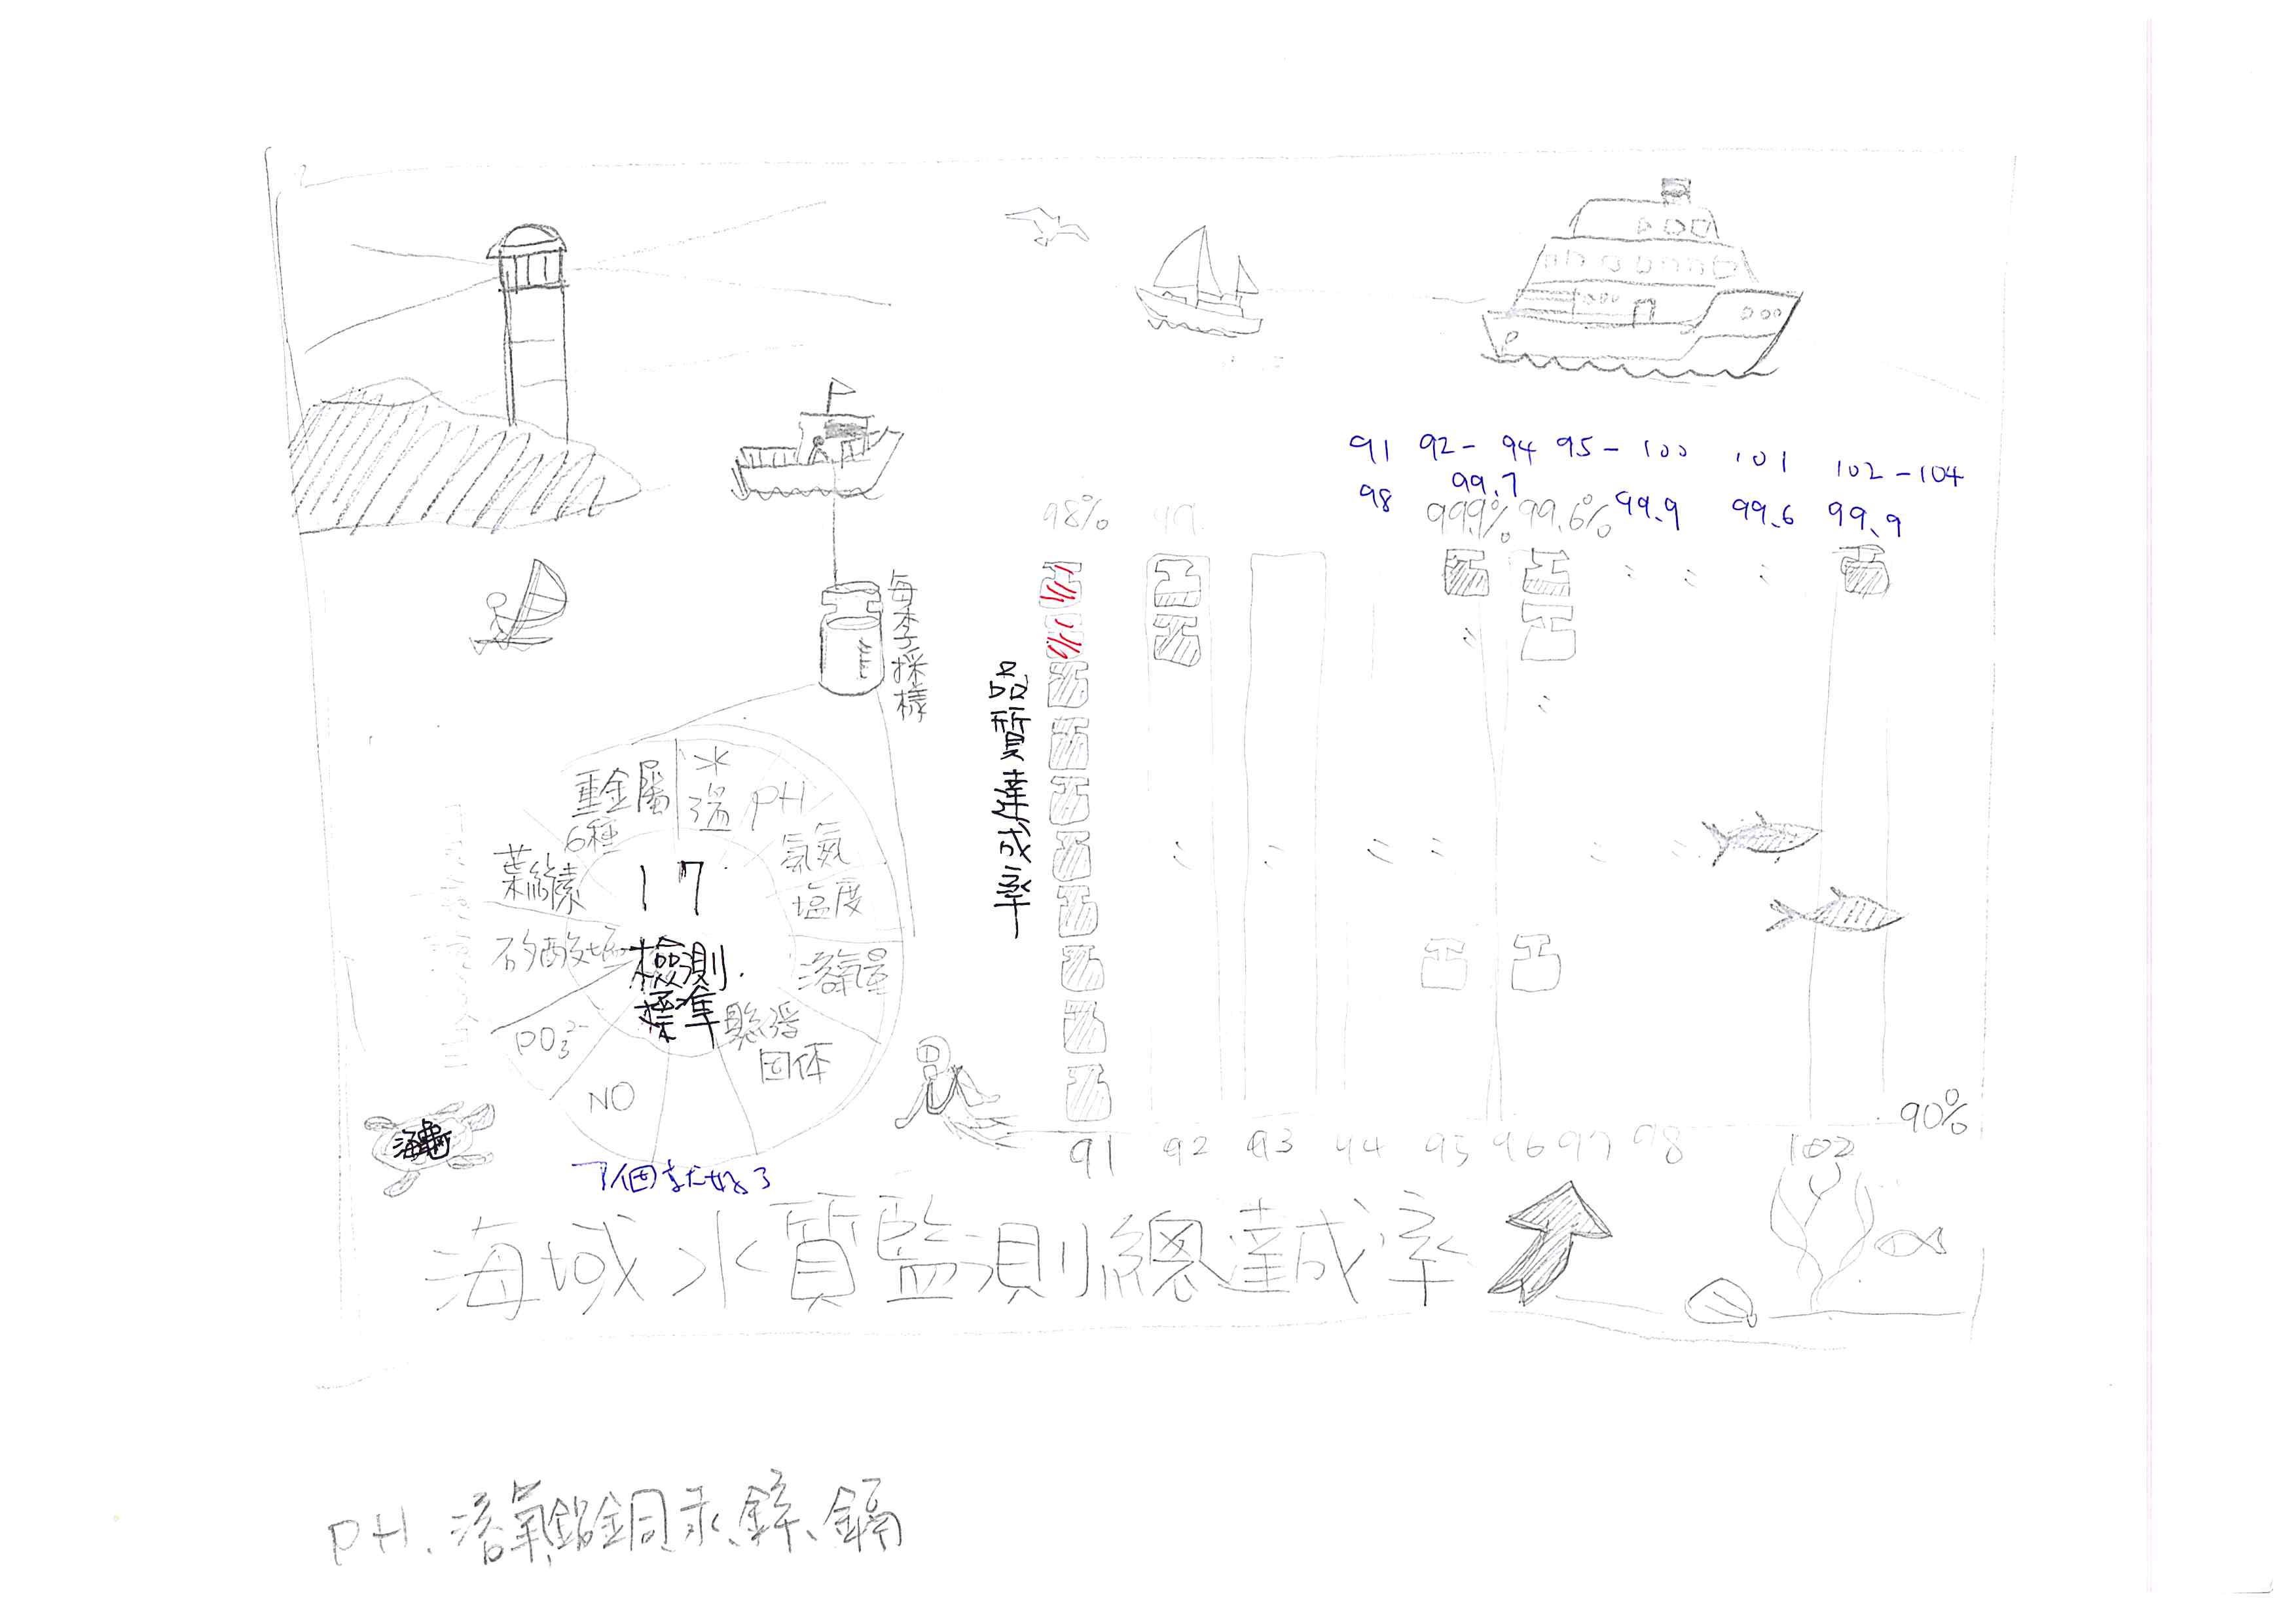
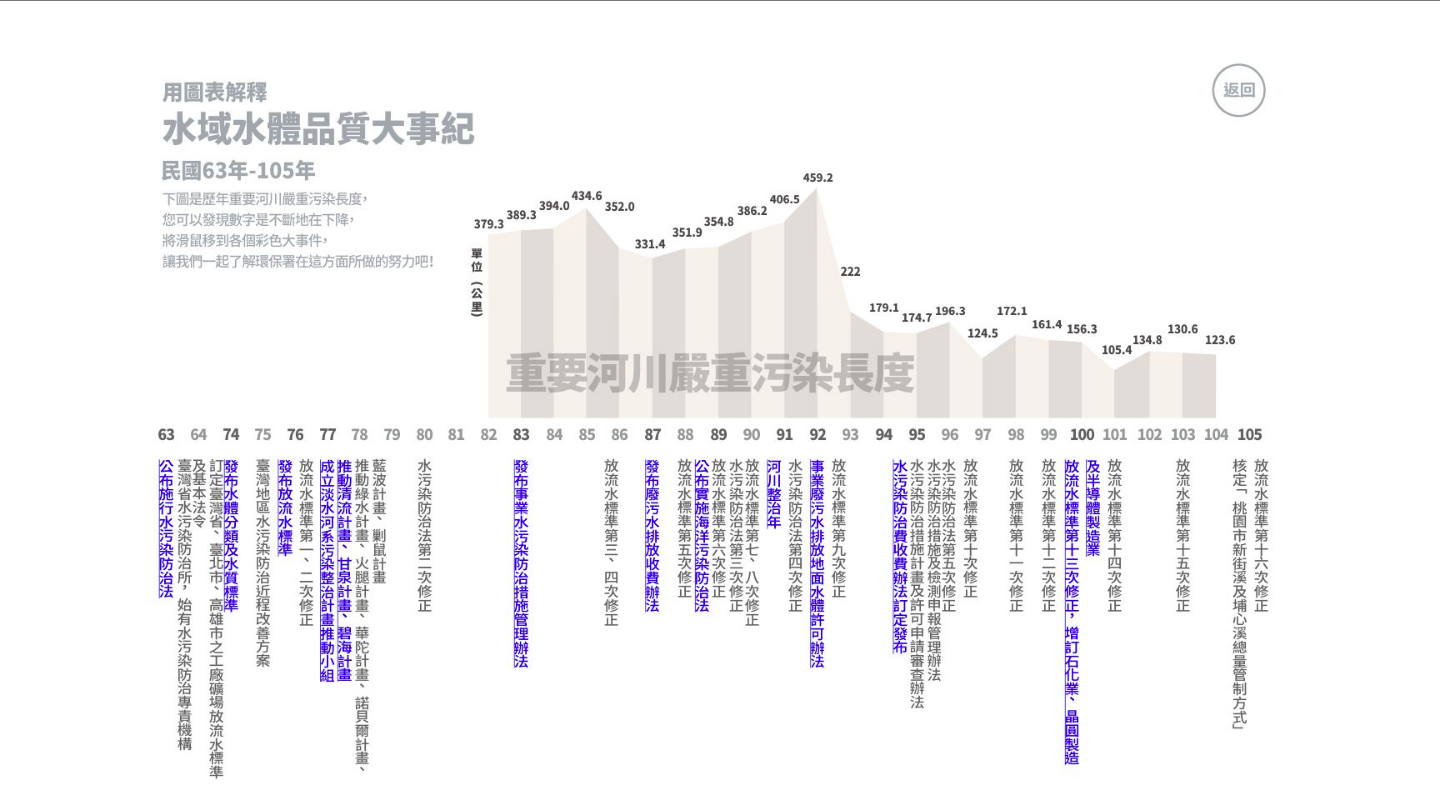
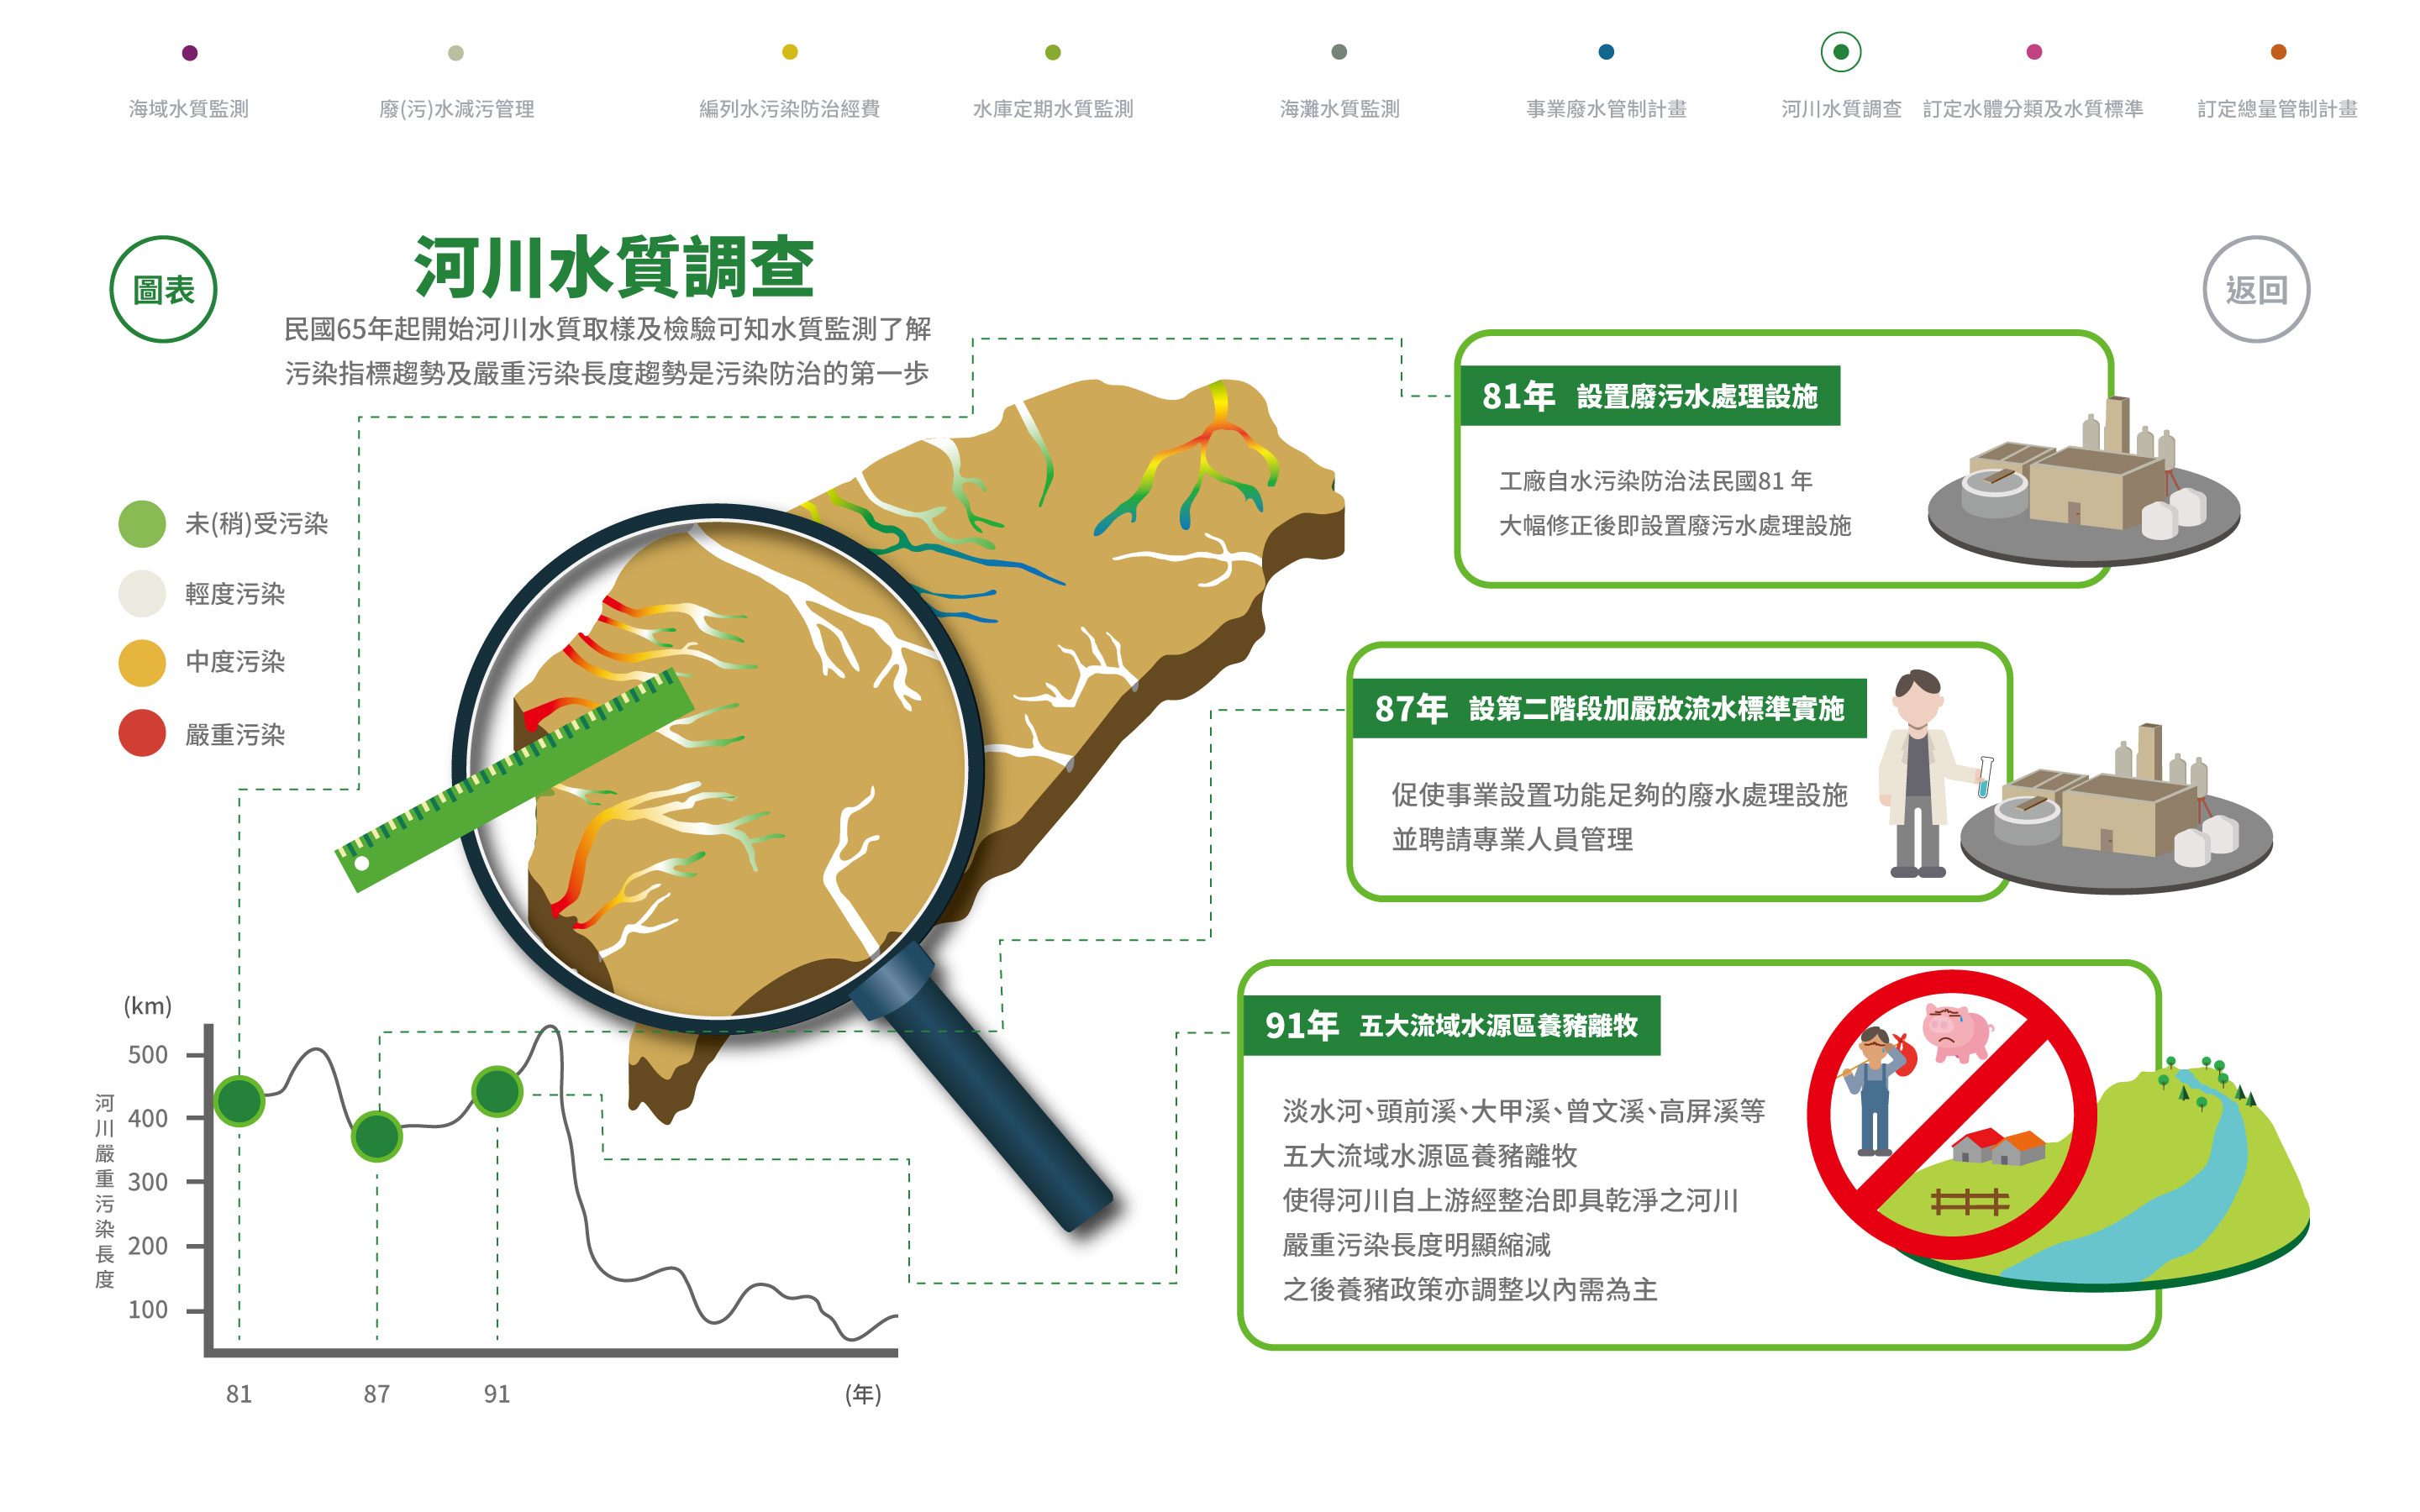
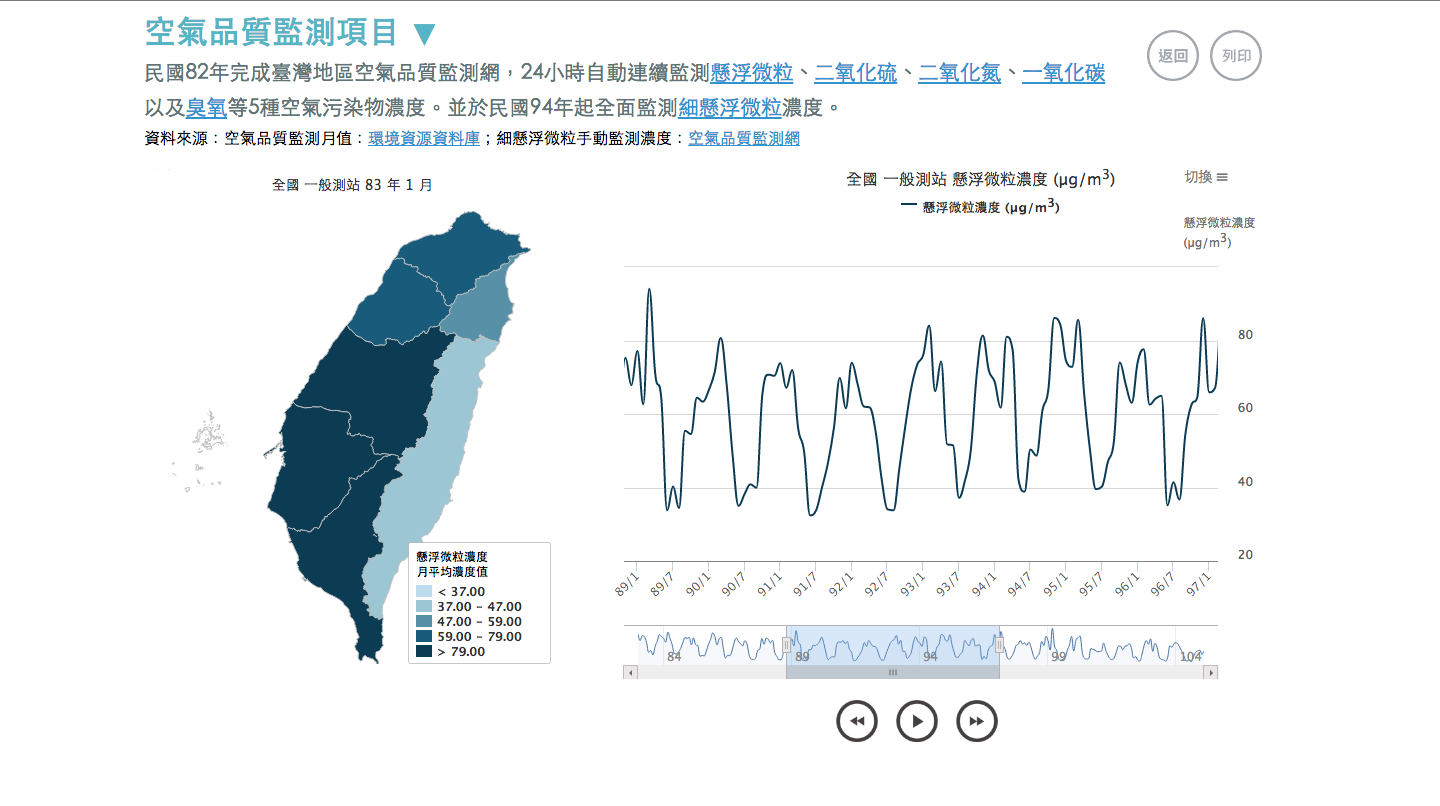
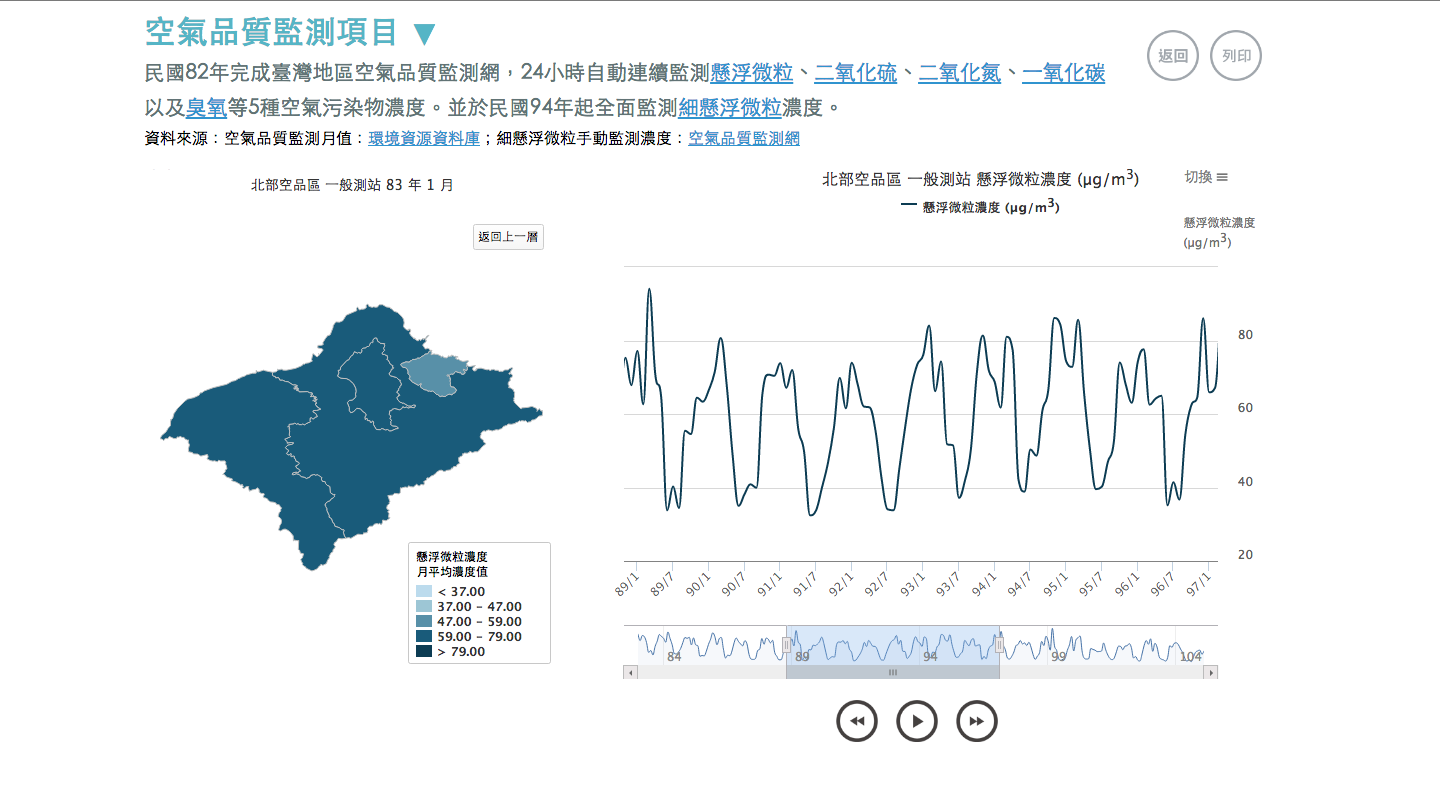
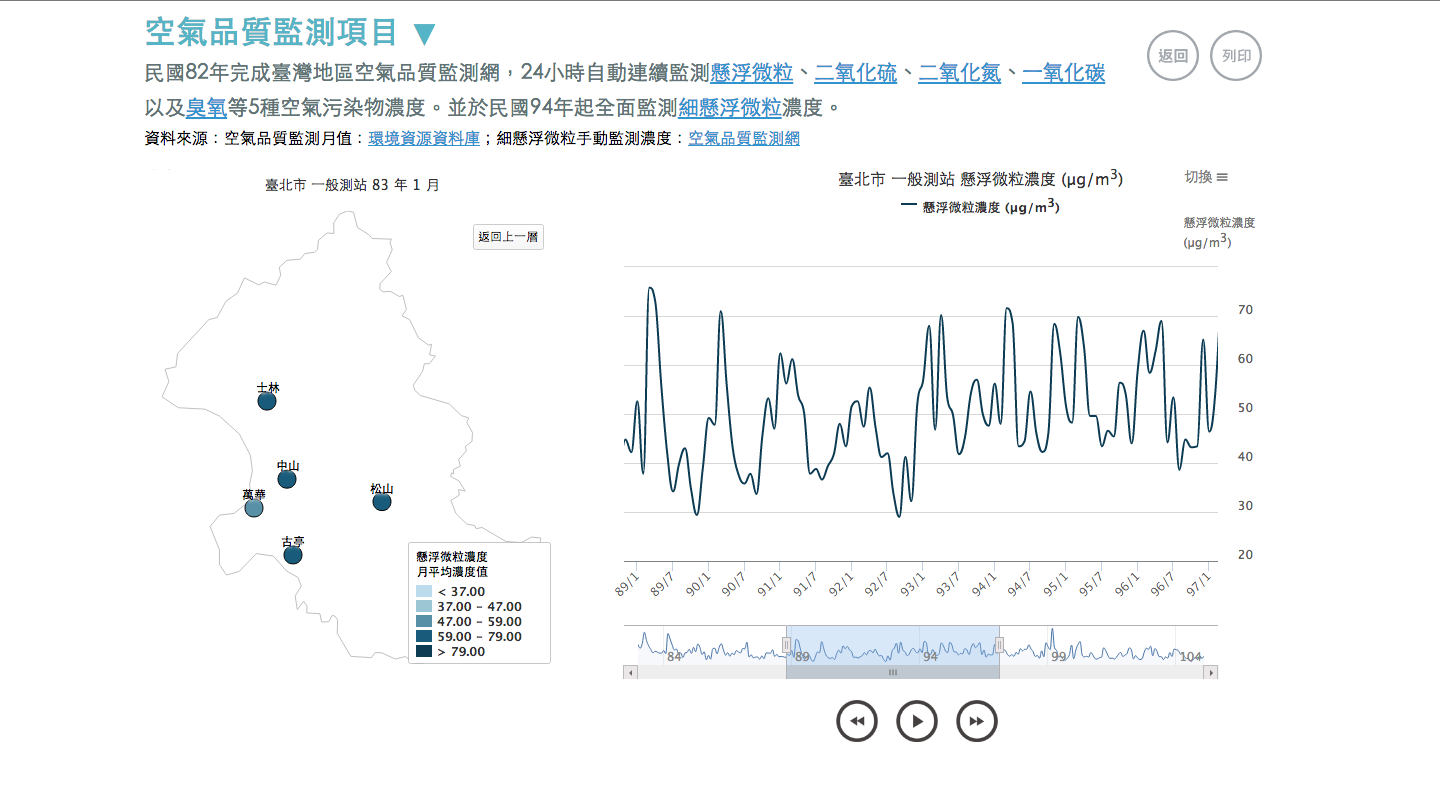
Prototyping for Interactive Charts and Maps
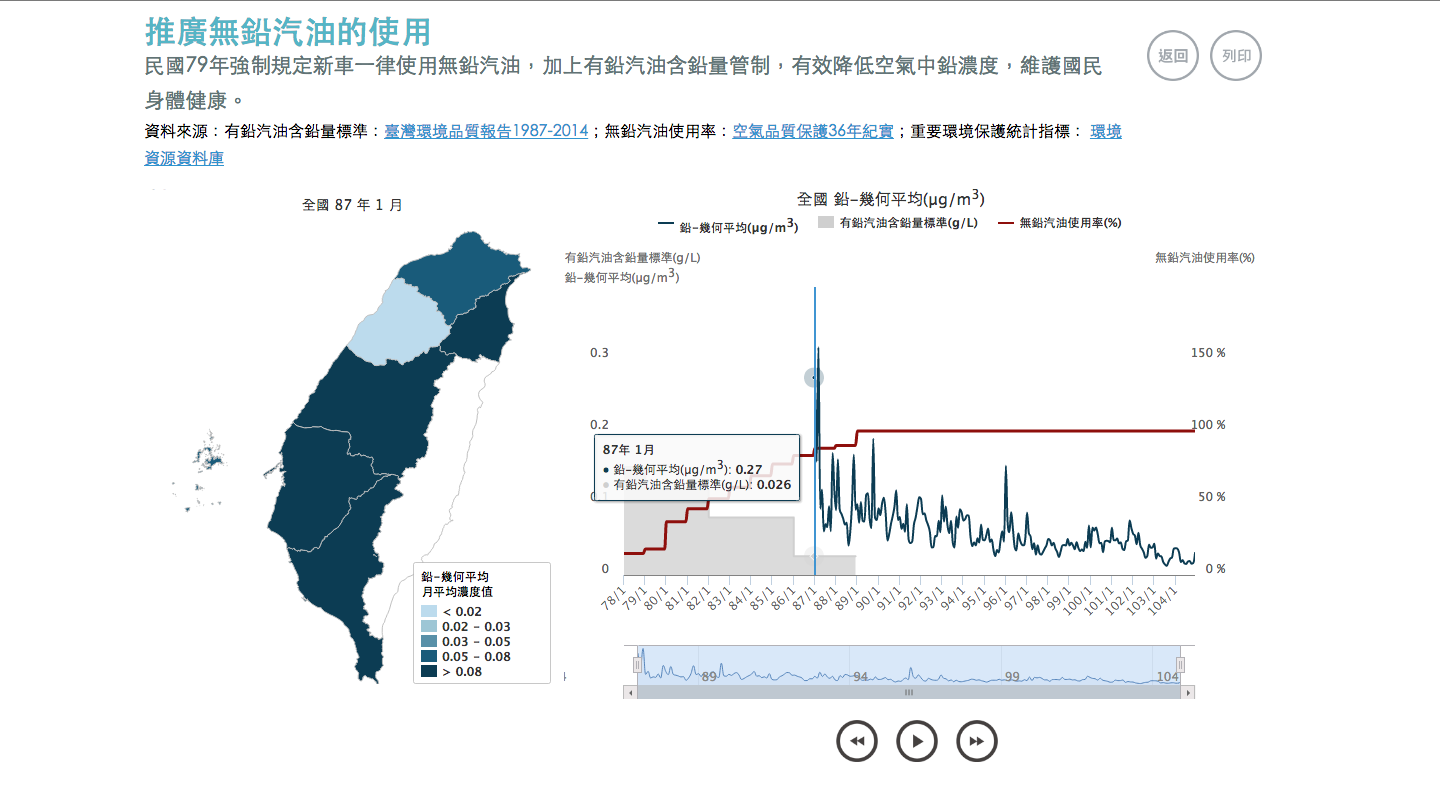
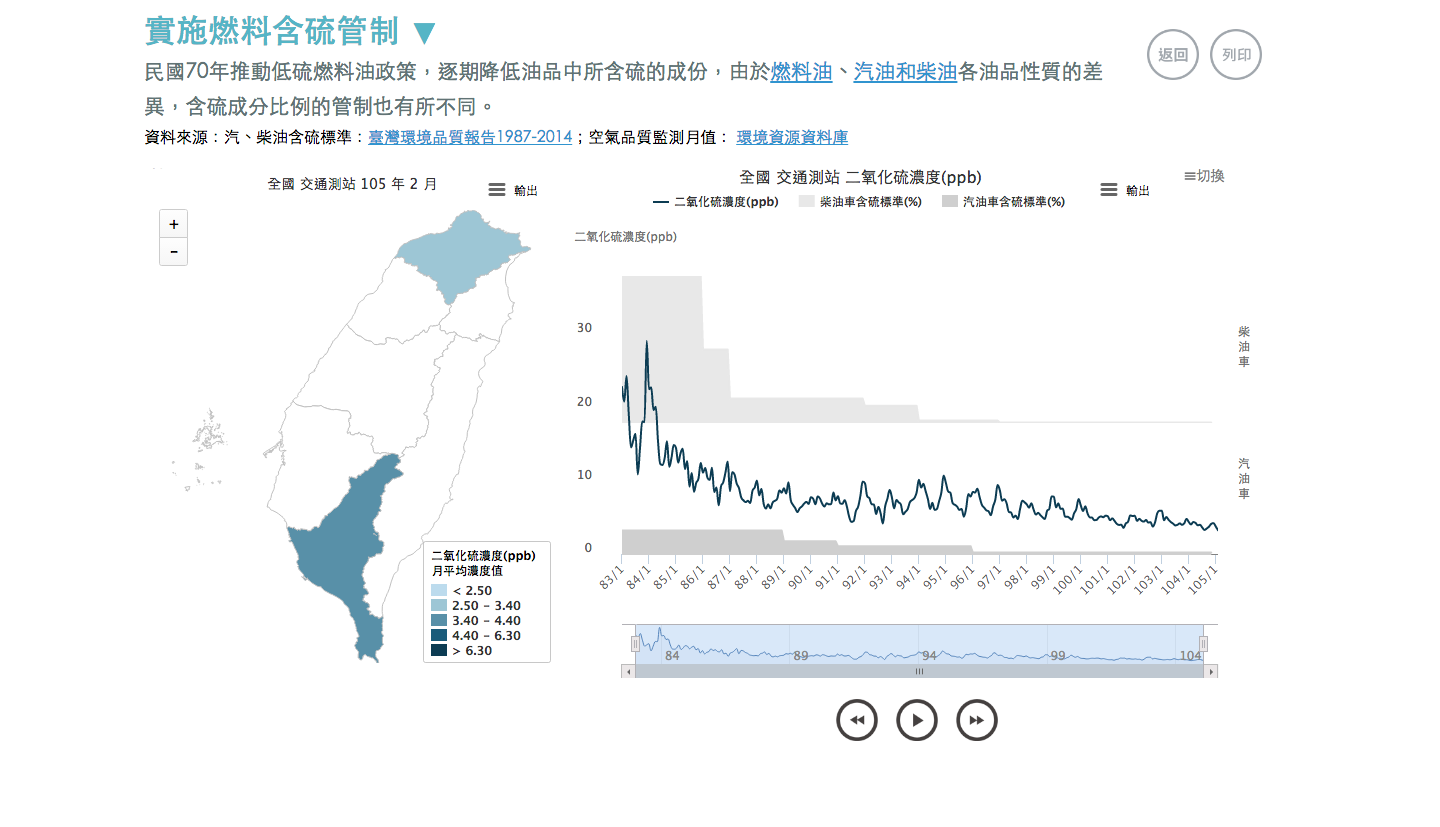
Convert relevant subject spacial data to interactive maps, and chronological species data to an interactive chart.


CONCLUSION
Result
The Environmental Protection Manifesto project will serve as a digital learning material. Through interactive maps and charts, we tell the story to let the public understand environmental quality changes in Taiwan in the last few years. The specific work objectives are as follows:
I. Education
In the trends of environmental improvement, we raise public awareness of various environmental issues and educate the public on how to protect our environment.
II. Policy advocacy
By understanding the long-term efforts of government and the meaning behind taxation and institutions, we can establish the reputation of related government departments.
III. Improvement of user experience
By interacting with the website, environmental data became amazing and easy to understand.